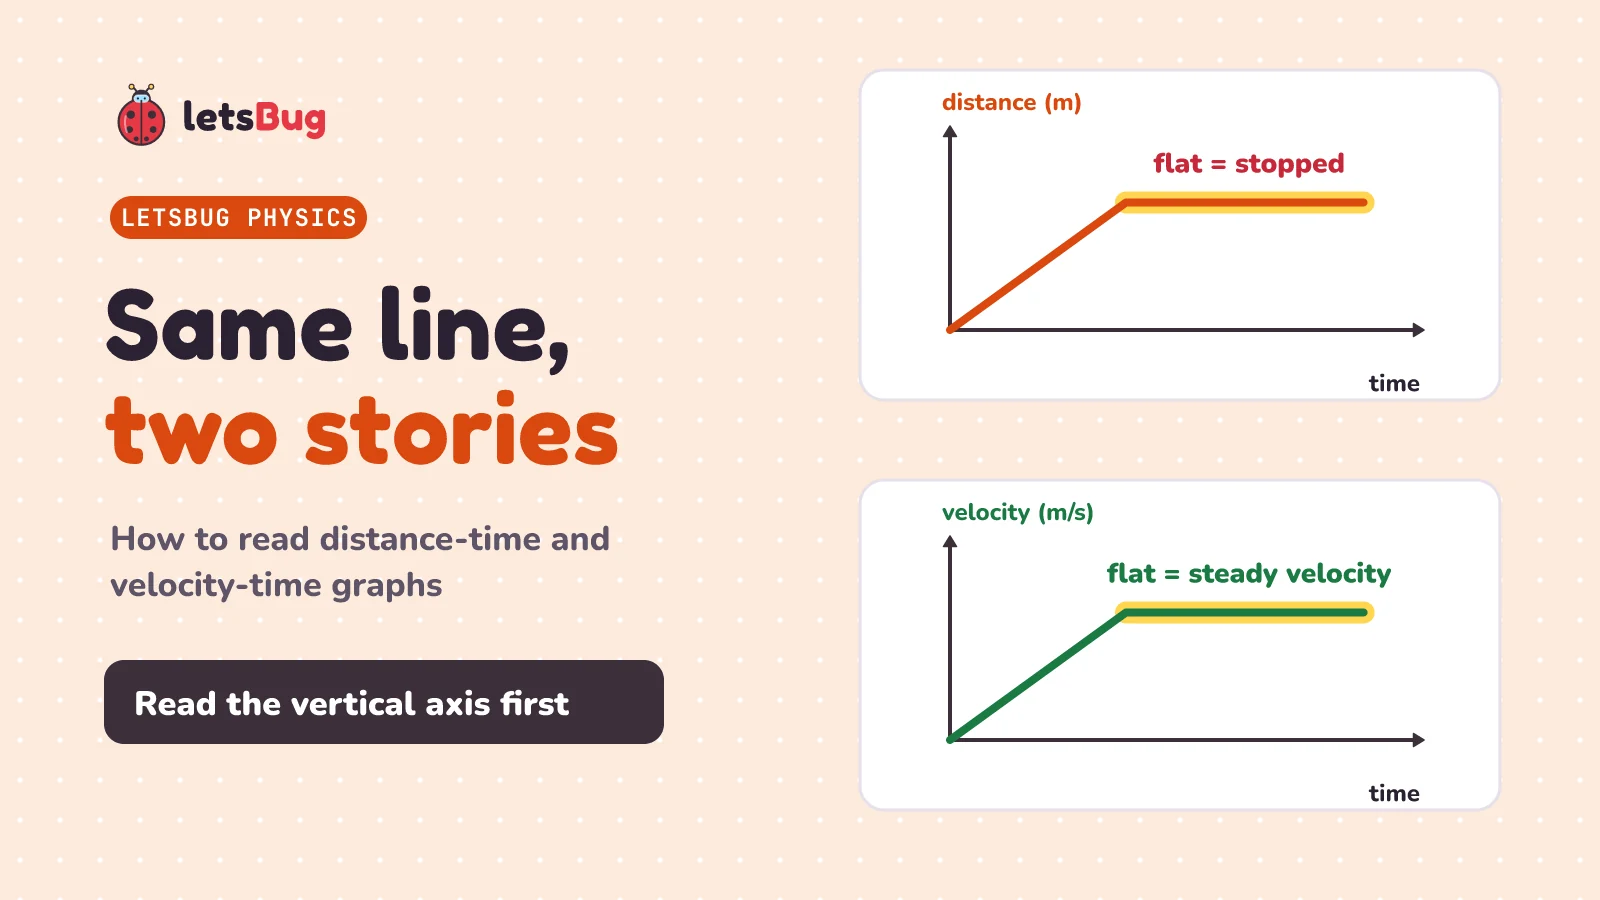
To read a motion graph, read the vertical axis first. On a distance-time graph, the gradient is the speed and a flat line means stopped. On a velocity-time graph, the gradient is the acceleration, a flat line means a constant velocity (not stopped), and the area under the line is the distance travelled.
In this post we test the "flat line means stopped" myth on Usain Bolt's world-record 100 m, find a speed from a distance-time graph, then follow a metro train between two stations: its acceleration from the gradient and its distance from the area. You'll also see the mistakes examiners reported in June 2025, and exam-style questions with model answers.
Key takeaways
- Read the vertical axis first. The same shape tells two different stories on a distance-time graph and a velocity-time graph.
- Distance-time graph: gradient = speed. Steeper means faster, flat means stopped, and a curve means the speed is changing.
- Velocity-time graph: gradient = acceleration. A flat line is a steady velocity with zero acceleration. Above the time axis, a line sloping down means slowing down, not going backwards.
- The area under a velocity-time graph is the distance travelled (strictly, the displacement). Split it into triangles (½ × base × height) and rectangles.
- Check the units: a velocity-time gradient comes out in m/s², an area in m. Change km/h to m/s (÷ 3.6) before you plot.
This post goes with letsBug Physics, episode 4. Motion graphs are in GCSE and IGCSE Physics, and in CBSE Class 9 Science (the new Exploration textbook, Chapter 4, Describing Motion Around Us). Watch the lesson, or read on: the post adds a cyclist's journey for you to graph, the examiners' own comments and more exam-style questions with model answers.
Does a flat line on a velocity-time graph mean stopped?
No. Let's test it on the fastest 100 m ever run. Usain Bolt's world record is 9.58 s, set at the 2009 World Championships in Berlin. Draw a velocity-time graph of a simple model of that race: the line climbs steeply as he speeds up out of the blocks, then levels off and stays almost flat to the finish.
A common answer for the flat part is "he's stopped". But that's the fastest part of the race. His top speed, measured between 60 m and 80 m, was 44.72 km/h, which is 44.72 ÷ 3.6 ≈ 12.4 m/s. On a velocity-time graph, a flat line means the velocity isn't changing: he keeps running at about 12.4 m/s. OpenStax says it about a car's flat velocity-time line: "This slope tells us that the car is not speeding up, or accelerating."
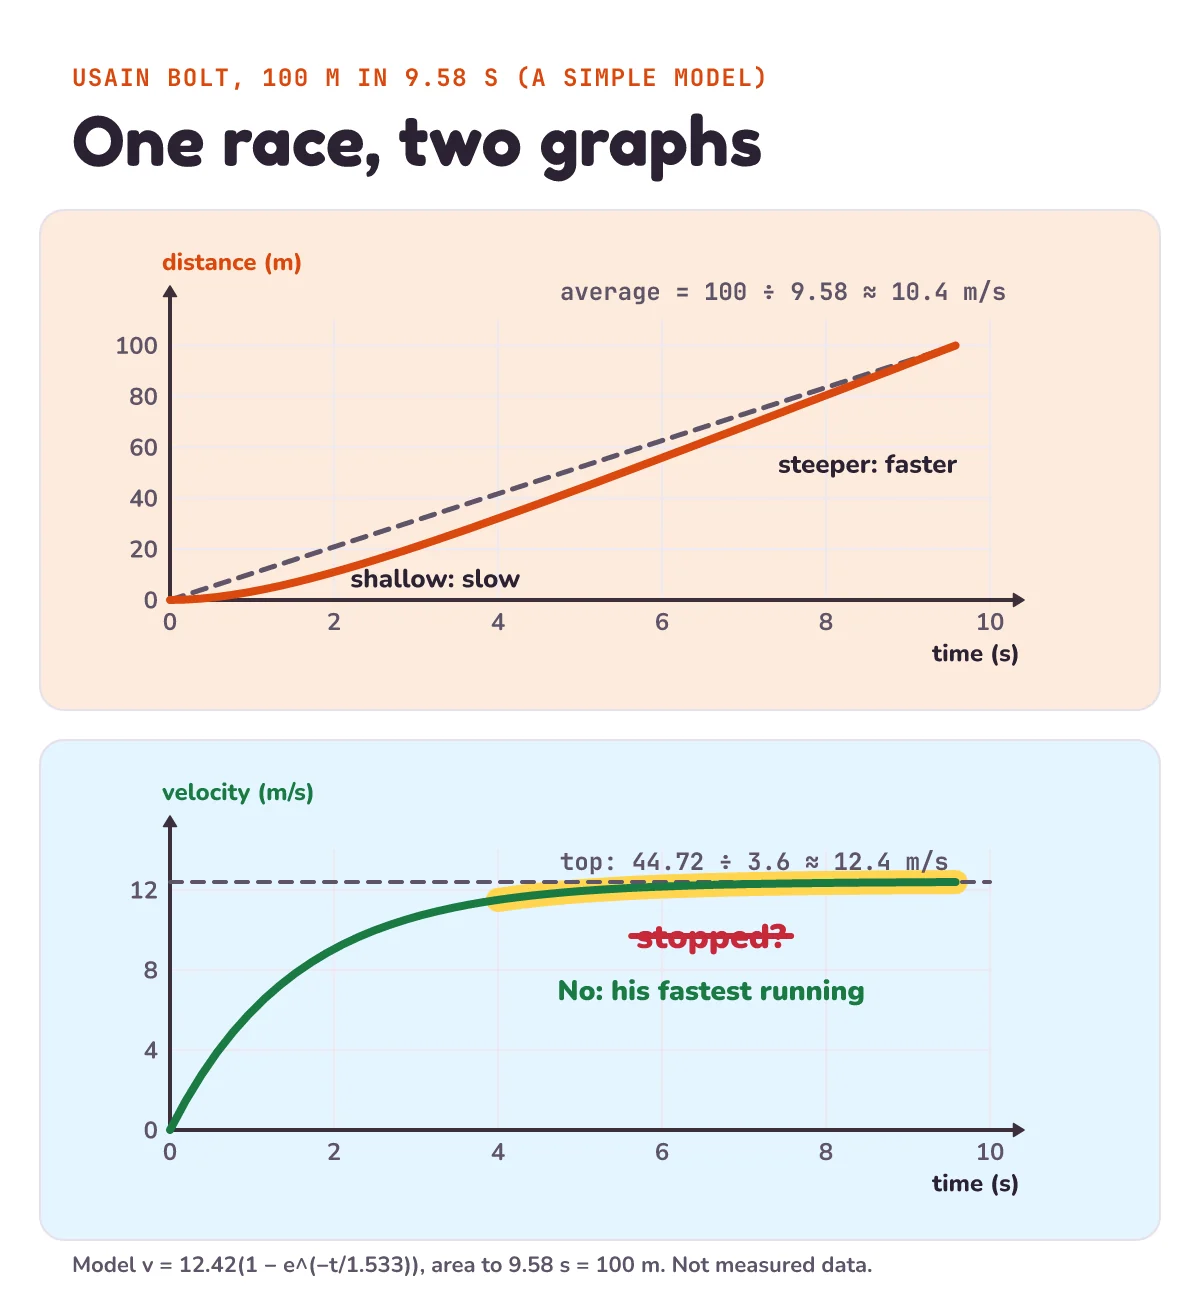
(The curve is a simple model, not measured data: v = 12.42(1 − e−t/1.533), chosen so that the area under it up to 9.58 s comes to 100 m, the length of the race. It leaves out details such as his reaction time at the start.)
This mix-up costs real marks. In the June 2025 Cambridge IGCSE Physics exams, examiners reported it on three theory papers. On a Core paper: "A number of candidates confused the graph with a distance–time graph and thought the car was at rest." On an Extended paper: "A few candidates described the train as stationary between t = 80 s and 480 s." And on another, some gave "an incorrect answer of ‘stationary’".
How do you tell a distance-time graph from a velocity-time graph?
Read the label on the vertical axis. The two graphs can have exactly the same shape and still tell different stories:
- On a distance-time graph, the height of the line is how far you've travelled. When the line goes flat, the distance stops changing, so you really are stopped.
- On a velocity-time graph, the height is your velocity. When the line goes flat, your velocity stops changing: you keep moving at the same speed, in the same direction.
- On a velocity-time graph, only a flat line at zero, along the time axis, means stopped.
The same examiner report gives the fix in one line: "Candidates should be encouraged to read the axes of the graph carefully to ensure that they are answering the question asked."
| Distance-time graph | Velocity-time graph | |
|---|---|---|
| Height of the line | Distance travelled | Velocity |
| Gradient | Speed (m/s) | Acceleration (m/s²) |
| Flat line | Stopped | Constant velocity, zero acceleration |
| Steeper line | Faster | Bigger acceleration |
| Area under the line | Not used | Distance travelled (m) |
How do you find speed from a distance-time graph?
The speed is the gradient: how steep the line is. Gradient = rise ÷ run = change in distance ÷ change in time. OpenStax puts it as "the slope in a d versus t graph, is the average velocity."
Bolt ran 100 m in 9.58 s. A straight line from (0 s, 0 m) to (9.58 s, 100 m) has a gradient of 100 ÷ 9.58 ≈ 10.4 m/s. That's his average speed for the race. In km/h it's 10.44 × 3.6 ≈ 37.6 km/h, which matches the 37.578 km/h average on Wikipedia's footspeed page.
His real distance-time line isn't straight, though. It starts shallow and gets steeper, because he's speeding up. That's the rule for reading any distance-time graph:
- Steeper means faster; shallower means slower.
- Flat means stopped.
- A straight line means a steady speed. A curve means the speed is changing.
For a curve, GCSE Higher tier asks for the speed at one moment. AQA's specification says: "If an object is accelerating, its speed at any particular time can be determined by drawing a tangent and measuring the gradient of the distance–time graph at that time." A tangent is a straight line that just touches the curve at that time.
Units first: Bolt's top speed in m/s
Speeds often come in km/h. Divide by 3.6 to get m/s, because 1 km/h = 1000 m ÷ 3600 s (the same conversion as in distance vs displacement). Bolt's top speed, 44.72 km/h, is about 12.4 m/s: the height of the flat part of his velocity-time graph. His average, 10.4 m/s, is lower because he starts from rest.
How do you find acceleration from a velocity-time graph?
On a velocity-time graph the gradient is the acceleration: change in velocity ÷ time taken. Let's take a journey you might make every day: a metro train between two stations. (It's a model journey with round numbers, not a real timetable.)
- Speeding up: from rest to 20 m/s in 20 s. Gradient = 20 ÷ 20 = 1 m/s².
- Cruising: flat at 20 m/s for 60 s, from 20 s to 80 s. Gradient = 0, so the acceleration is 0. The train isn't stopped: 20 m/s is 20 × 3.6 = 72 km/h.
- Braking: from 20 m/s to 0 in 25 s, from 80 s to 105 s. Gradient = −20 ÷ 25 = −0.8 m/s².
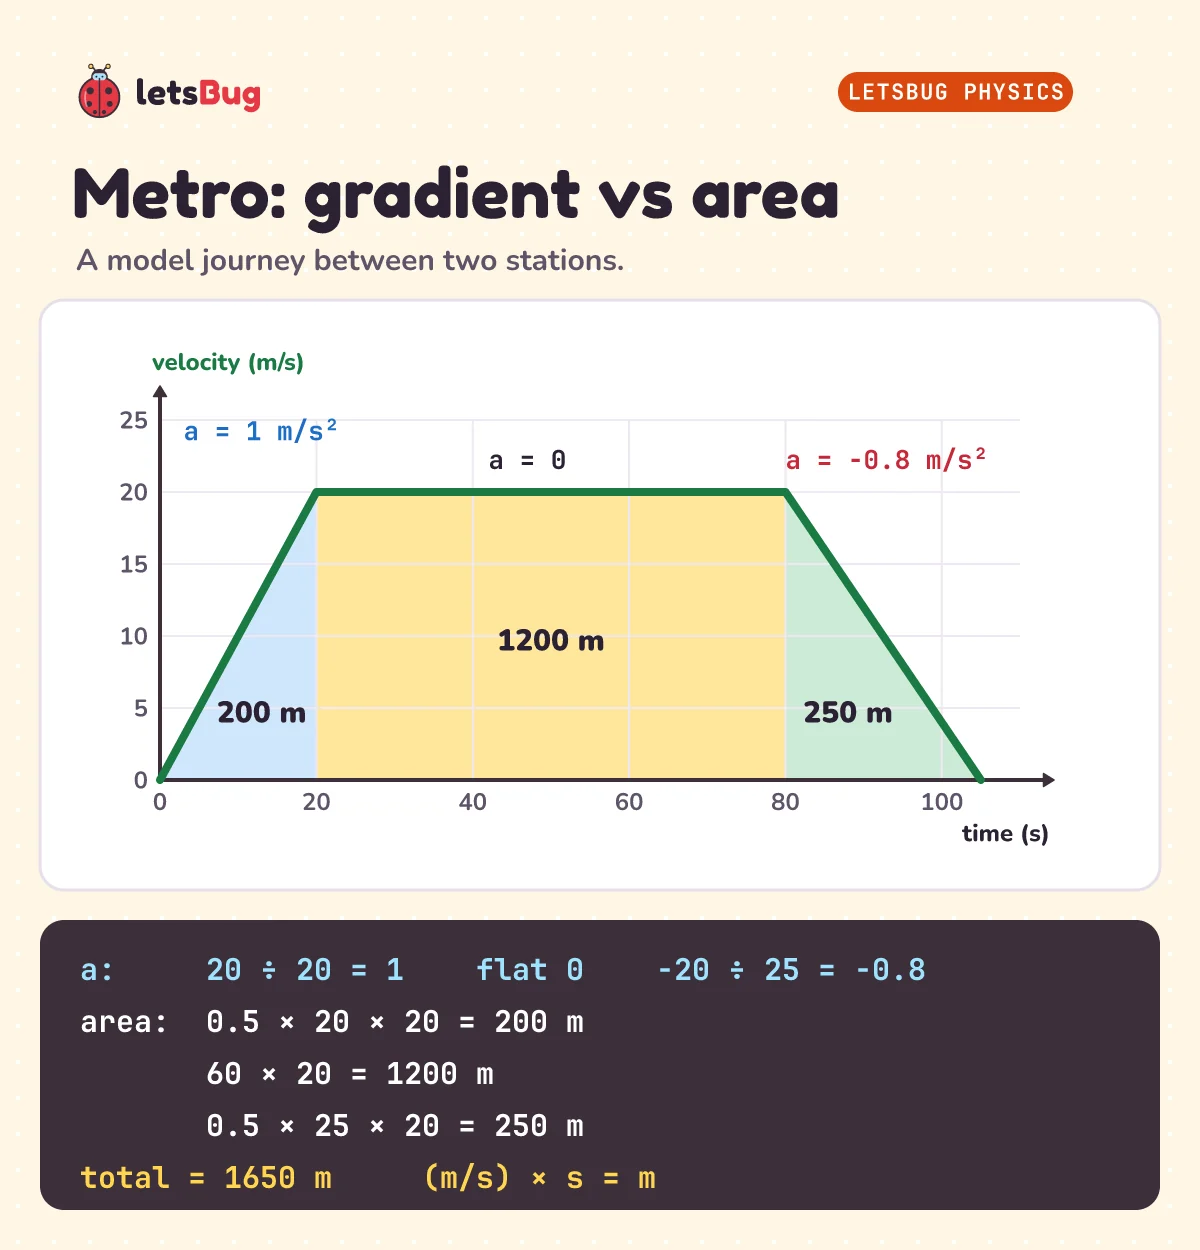
Above the time axis, a line that slopes down means slowing down, not going backwards. The velocity is still positive all the way down; it's just getting smaller. And a flat line means no acceleration, so the forces on the train are balanced: as Newton's second law says, an object only accelerates when there's a resultant force.
How do you find the distance from a velocity-time graph?
The area under a velocity-time graph is the distance travelled. Split it into shapes you can find the area of:
- Speeding up is a triangle: ½ × 20 s × 20 m/s = 200 m.
- Cruising is a rectangle: 60 s × 20 m/s = 1200 m.
- Braking is another triangle: ½ × 25 s × 20 m/s = 250 m.
Add them up: 200 + 1200 + 250 = 1650 m between the stations. Check the units: (m/s) × s = m. And notice that the flat part, the bit people call "stopped", covers the most distance of all.
Strictly, the area gives the displacement. OpenStax: "The area under a velocity curve represents the displacement." For a train going one way, that's the same as the distance, which is why AQA writes: "The distance travelled by an object (or displacement of an object) can be calculated from the area under a velocity–time graph." When the line is curved, like Bolt's, Higher tier asks you to "measure, when appropriate, the area under a velocity–time graph by counting squares."
The two area mistakes examiners see
- Forgetting the ½. On one June 2025 Core paper, "Many candidates scored full credit for determining the distance travelled as 44 m." But others "did not use the correct equation for determining the area of a triangle and so 88 m was a frequently seen incorrect answer." 88 is exactly 2 × 44: what you get if you leave out the ½.
- Using distance = speed × time for the whole trip. On an Extended paper: "Weaker candidates attempted to use s = vt instead of the area under the graph." Try it on the metro: 20 m/s × 105 s = 2100 m, which is 450 m too much, because the train isn't at 20 m/s while it speeds up and brakes.
How do you describe motion from a velocity-time graph?
A typical 3-mark question: The graph shows the metro train's journey. Describe its motion between 20 s and 80 s, and work out the distance it travels in that time.
A weak answer: "The train is stopped, because the line is flat." That's the distance-time rule used on the wrong graph. Another weak one: "It's constant." Constant what? Name the quantity: "constant velocity", not just "constant" or "no acceleration". The June 2025 examiners flagged exactly that: "A common incomplete answer was ‘constant’ or ‘constant motion’ without stating what was constant."
A full-mark answer has three parts:
- The train moves at a constant velocity of 20 m/s. [1]
- The line is flat but above zero, so the train is moving, not stopped: its acceleration is zero, but its velocity isn't. [1]
- Distance = area under the graph = 20 × 60 = 1200 m. [1]
In India, the new NCERT Class 9 Science textbook (Exploration) covers both graphs in Chapter 4, Describing Motion Around Us, including the area under a velocity-time graph as the displacement.
Your turn. Work each one out before you open the answers.
1) A car pulls away from traffic lights. It speeds up steadily from rest to 12 m/s in 6 s, then drives at a steady 12 m/s for 10 s. Sketch the velocity-time graph, then find the acceleration and the total distance.
2) A cyclist rides 1200 m in 4 minutes, waits at a junction for 2 minutes, then rides 1800 m more in 5 minutes. Sketch the distance-time graph. Find her speed in each part, and her average speed for the whole trip.
3) A train cruises at 90 km/h. How high is the flat line on its velocity-time graph, in m/s?
Show the answers
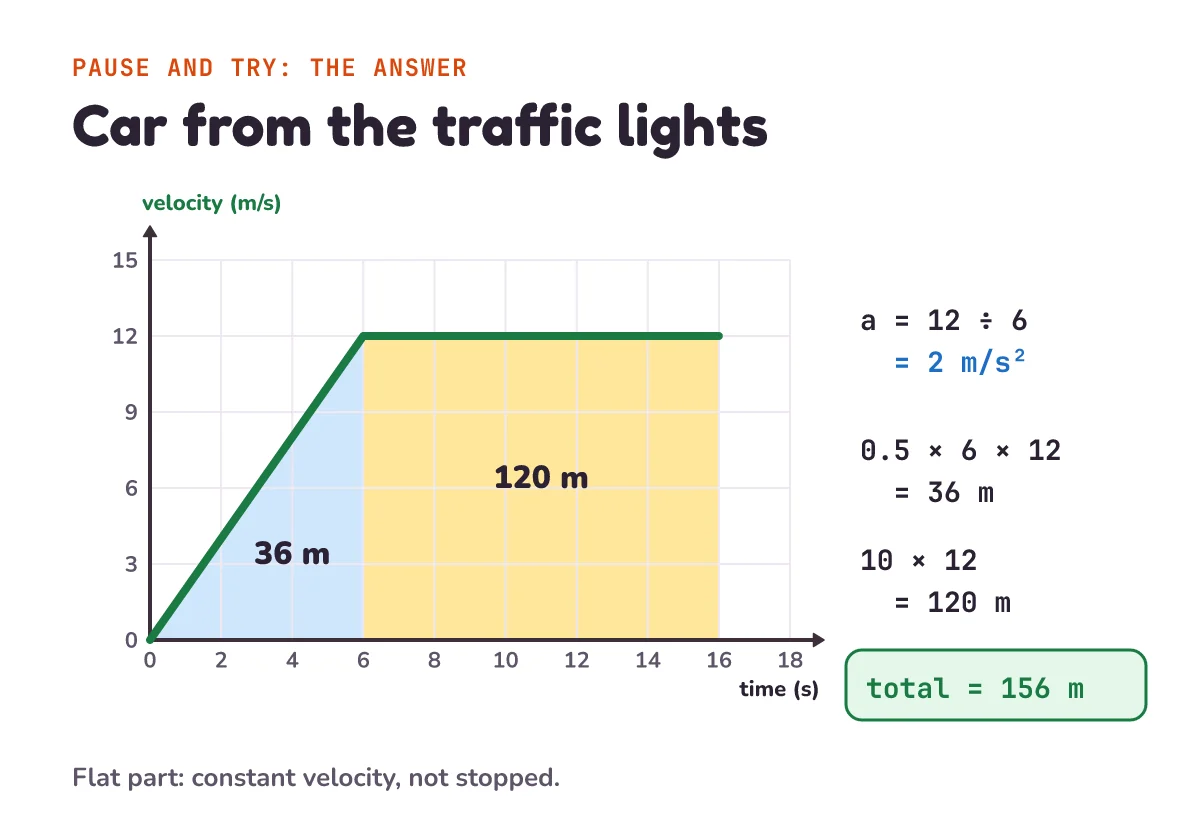
1) Acceleration = gradient = 12 ÷ 6 = 2 m/s². Distance = area: the triangle is ½ × 6 × 12 = 36 m and the rectangle is 10 × 12 = 120 m, so the total is 156 m. The flat part is a constant velocity, not stopped.
2) Units first: 4 min = 240 s, 2 min = 120 s, 5 min = 300 s. Speeds: 1200 ÷ 240 = 5 m/s, then 0 m/s (a flat line), then 1800 ÷ 300 = 6 m/s, so the last part of the graph is the steepest. Average speed = total distance ÷ total time, stop included: 3000 ÷ 660 ≈ 4.5 m/s.
3) 90 ÷ 3.6 = 25 m/s.
Exam-style questions with model answers
The marks in brackets are our estimate: one mark for each correct step or idea.
Q1 (1 mark). What does the gradient of a distance-time graph represent?
Model answer
The speed [1].
Q2 (2 marks). Someone says a horizontal line on a velocity-time graph shows the object is at rest. Explain why they are wrong.
Model answer
The line shows the velocity is not changing: the object moves at a constant velocity [1]. At rest would need v = 0: a horizontal line along the time axis [1].
Q3 (4 marks). A lift speeds up from rest to 3 m/s in 2 s, moves at 3 m/s for 8 s, then slows to a stop in 3 s. Find (a) its acceleration in the first 2 s, (b) its acceleration while it stops, and (c) the total distance it travels.
Model answer
(a) 3 ÷ 2 = 1.5 m/s² [1].
(b) −3 ÷ 3 = −1 m/s², a deceleration of 1 m/s² [1].
(c) Area = ½ × 2 × 3 + 8 × 3 + ½ × 3 × 3 [1] = 3 + 24 + 4.5 = 31.5 m [1].
Q4 (2 marks). A student says the metro train covers 20 × 20 = 400 m while it speeds up from 0 to 20 m/s in 20 s. Find the mistake and correct it.
Model answer
The area under that part of the graph is a triangle, not a rectangle, so it needs the ½ [1]: ½ × 20 × 20 = 200 m [1].
Questions people ask
How do you read a distance-time graph?
The gradient is the speed. A steeper line means faster, a flat line means stopped, and a curve means the speed is changing. Bolt's 100 m in 9.58 s has an average gradient of 100 ÷ 9.58 ≈ 10.4 m/s.
Does a flat line on a velocity-time graph mean stopped?
No. It means the velocity isn't changing: the object moves at a constant velocity with zero acceleration. Only a flat line at zero velocity, along the time axis, means stopped.
What does the gradient of a velocity-time graph show?
The acceleration, in m/s². A line sloping down has a negative gradient: above the time axis, that means slowing down. A train braking from 20 m/s to 0 in 25 s has an acceleration of −0.8 m/s².
What does the area under a velocity-time graph show?
The distance travelled (strictly, the displacement). Split it into triangles and rectangles: the model metro journey is 200 + 1200 + 250 = 1650 m.
What does a curved distance-time graph mean?
The speed is changing. If the curve gets steeper, the object is speeding up; if it gets flatter, it's slowing down. For the speed at one moment, draw a tangent and find its gradient.
What is the difference between a distance-time and a velocity-time graph?
The vertical axis. A distance-time graph shows how far you've travelled, so its gradient is the speed. A velocity-time graph shows your velocity, so its gradient is the acceleration and its area is the distance.
Keep going
- Watch the full lesson, How to Read Distance-Time and Velocity-Time Graphs, and its Short, Flat Line on a Velocity-Time Graph: Is the Train Stopped? More in letsBug Physics on YouTube.
- The episode before this one, where speed and velocity split: distance vs displacement, and how displacement can be zero.
- What makes the velocity change: Newton's second law examples in everyday life.
- Another graph you read axes first: how to read a climate graph.
Checked on 24 October 2026 against the 8 sources below. Every gradient, area and practice answer in this post was worked out again in a Python script, and every quote was matched word for word with the source text.
Sources
- OpenStax Physics: 2.3 Position vs. time graphs (the slope is the average velocity) and 2.4 Velocity vs. time graphs (the slope is the acceleration; the area is the displacement)
- Save My Exams: Distance-time graphs (steep, shallow and flat lines)
- AQA: GCSE Physics 8463, 4.5 Forces (gradients, tangents and the area under a velocity-time graph)
- Cambridge IGCSE Physics 0625: June 2025 principal examiner report (unofficial copy on PapaCambridge; Papers 31, 41 and 42: flat lines read as stationary, the 88 m triangle slip, s = vt)
- Wikipedia: Footspeed (Bolt's 44.72 km/h top speed and 37.578 km/h average) and Usain Bolt (the 9.58 s world record, Berlin 2009)
- Tiwari Academy: NCERT Class 9 Science Exploration, Chapter 4 (what the chapter covers: both graphs, slope and area)