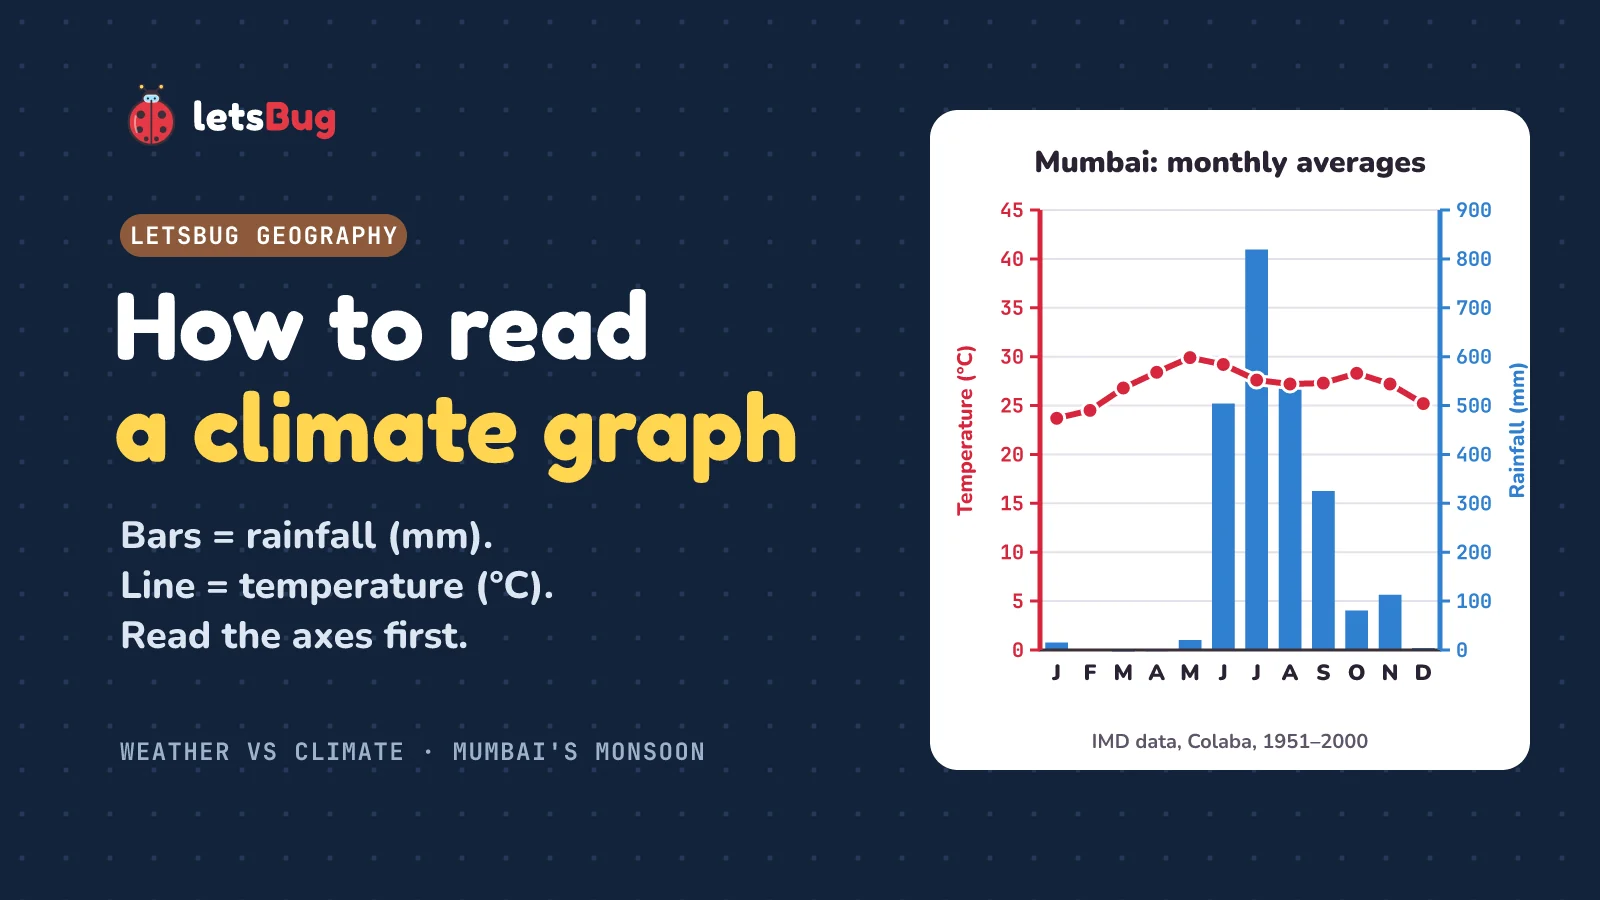
To read a climate graph, read the axes first. The months run along the bottom, the bars show rainfall in millimetres (mm) on one vertical axis, and the line shows temperature in degrees Celsius (°C) on the other. Then find the warmest and coolest months, the temperature range, the wettest and driest months, and the year's total rainfall.
A climate graph shows climate, not weather. Weather is what the atmosphere is doing at one place over hours or days. Climate is the average of that weather over a long time, usually 30 years.
In this post we'll read a real climate graph for Mumbai, made from India Meteorological Department averages, find out why its hottest month is May and not July, compare it with London on the same scales, and write a 4-mark "describe" answer that picks up every mark.
Key takeaways
- Weather is the state of the atmosphere over hours or days. Climate is the average weather of a place over a long period, usually 30 years.
- On a climate graph, the bars are rainfall (mm) and the line is temperature (°C). Check which axis belongs to which before you read a value.
- Temperature range = warmest month − coolest month. For Mumbai: 29.9 − 23.7 = 6.2 °C, about 6 °C.
- Mumbai's July brings 819 mm of rain on average, more than London gets in a whole year (557.5 mm).
- Mumbai's hottest month is May, not July: monsoon cloud and rain keep June to August cooler.
- Describe means say what the graph shows, with numbers, units and months. Explain means say why.
This post goes with letsBug Geography, episode 3. It covers the weather and climate part of Unit 3, "Atmosphere and Climate", in the CBSE Class 9 Social Science curriculum for 2026-27, and the climate graphs that Cambridge IGCSE and GCSE geography papers ask you to read. Watch the lesson, or read on: the post adds the full data table, a London comparison on the same scales and exam-style questions with model answers.
Weather vs climate: what's the difference?
Weather and climate are made of the same things: temperature, rainfall, wind, cloud, humidity and air pressure. What's different is the timescale. The Met Office puts it plainly: "The major difference between weather and climate is the timescale. Weather occurs over hours or days." Climate is "the general weather over a long period", and "We usually define a region's climate over a period of 30 years."
- Weather is the state of the atmosphere at one place and one time: today's rain, this afternoon's wind. It can change in an afternoon.
- Climate is the average weather of a place over a long period, usually 30 years. It shifts over decades.
The Met Office quotes the writer Robert A. Heinlein for an easy way to remember it: "Climate is what we expect, weather is what we get."
Why 30 years? Weather services around the world average their records over the same 30-year blocks, called climate normals, so that places and decades can be compared fairly. The World Meteorological Organization's normals "are calculated for a uniform 30-year period", now "the most recent 30-year period finishing in a year ending with 0", such as 1981–2010 or 1991–2020. The London figures in this post are for 1981–2010. The Mumbai figures cover a longer stretch, 1951–2000: 50 years of records.
One day of weather vs a month of climate
On 26 July 2005, "The Indian Meteorological Department (IMD) station in Santacruz recorded 944 millimetres" of rain in a single day. "This is the wettest day on record in Mumbai." Santacruz's average rainfall for the whole of July (IMD's 1991–2020 averages) is 919.9 mm. So one day brought more rain than the city expects in an entire month. Mumbai's storm drains, "capable of carrying only 25 millimetres of water per hour", couldn't cope: streets turned into rivers, and across Maharashtra about 1,094 people died in the floods.
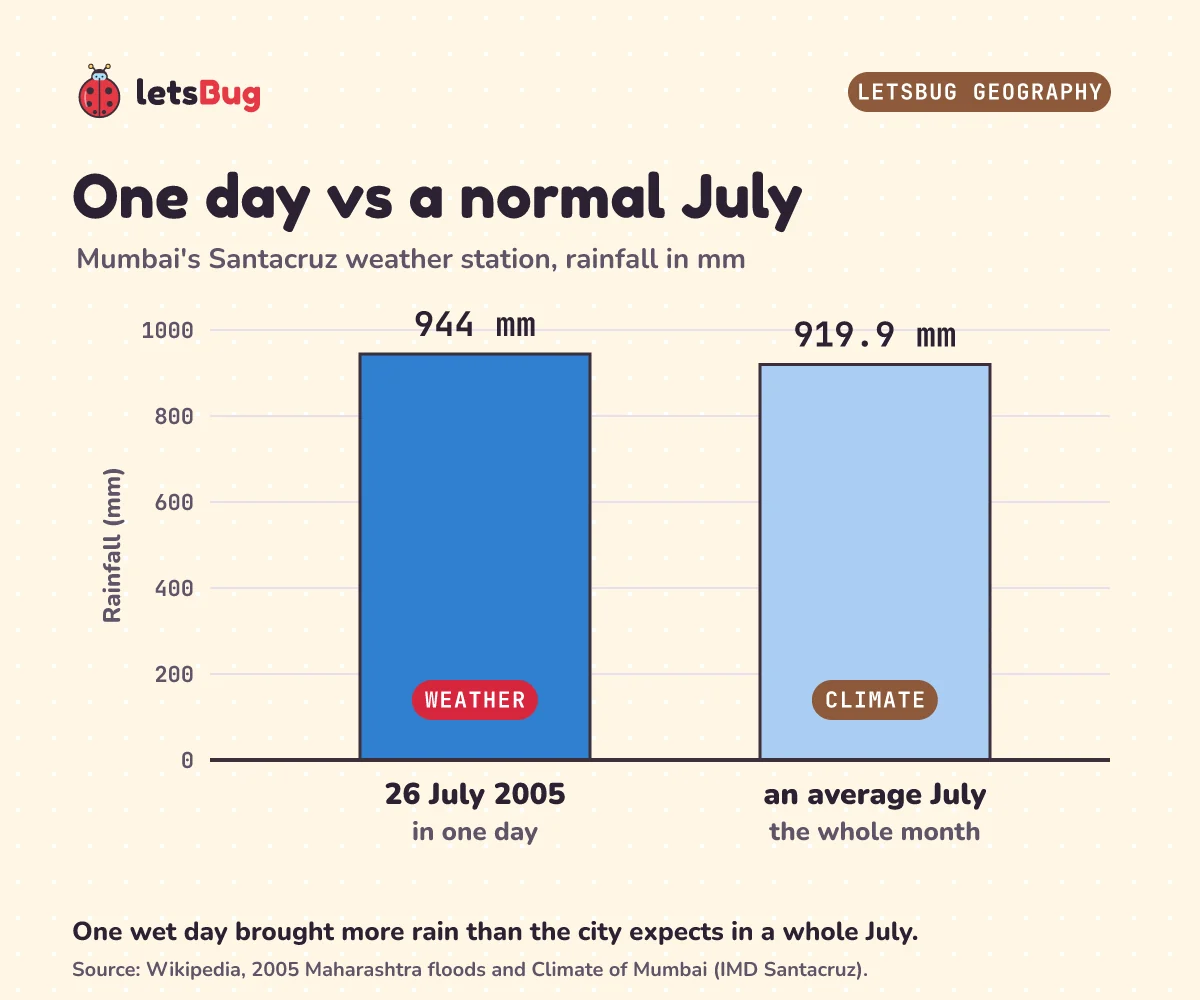
That one day was weather. The 919.9 mm July average is climate: what a July in Mumbai normally brings. A climate graph only shows averages, so the record-breaking day of 2005 doesn't stand out on it at all. (Our graph below uses a different station, Colaba in south Mumbai, and older 1951–2000 averages, so its July figure is lower: 819 mm. Two stations, two periods, two numbers.)
Myth: "one cold week disproves global warming"
Here's a mix-up that costs marks. Picture a freezing week in a London January, and someone says, "So much for global warming!" That treats weather as if it were climate. One cold week is weather. Climate is the 30-year average, and one week barely moves it.
Try sorting these. If a sentence is about one day or one event, it's weather. If it's about what usually happens, it's climate.
- "It's raining in Delhi today." Weather.
- "Mumbai's wet season runs from June to September." Climate.
- "A cyclone is expected this weekend." Weather.
- "Antarctica is cold all year round." Climate.
Plan with climate, react to weather
Why does the difference matter? Because people plan with climate and react to weather.
In India, "Kharif crops are usually sown at the beginning of the first rains during the advent of the south-west monsoon season, and they are harvested at the end of monsoon season (October–November)." "Rice is the most important Kharif crop of India." Farmers grow a thirsty crop like rice because the climate promises a wet season every year, starting in June: in Mumbai, "The official date for the monsoon to hit the city is 10 June." That's a climate decision. The day they actually sow depends on when the first rains really arrive, and that's reacting to the weather. The CBSE curriculum asks you to "Understand the impact of the Indian monsoon on life, agriculture, and livelihoods across different regions." Mumbai's drains, built for 25 mm an hour, show the same idea: how big to build a drain is a climate question.
A weather forecast is for today and tomorrow: take an umbrella, or delay a flight. Climate tells you what to plant and what to build. Weather tells you what to do today.
How to read a climate graph: axes first
A climate graph puts a place's average monthly temperature and rainfall on one chart. Here's Mumbai's, drawn from IMD's averages for Colaba, the weather station that represents south Mumbai.
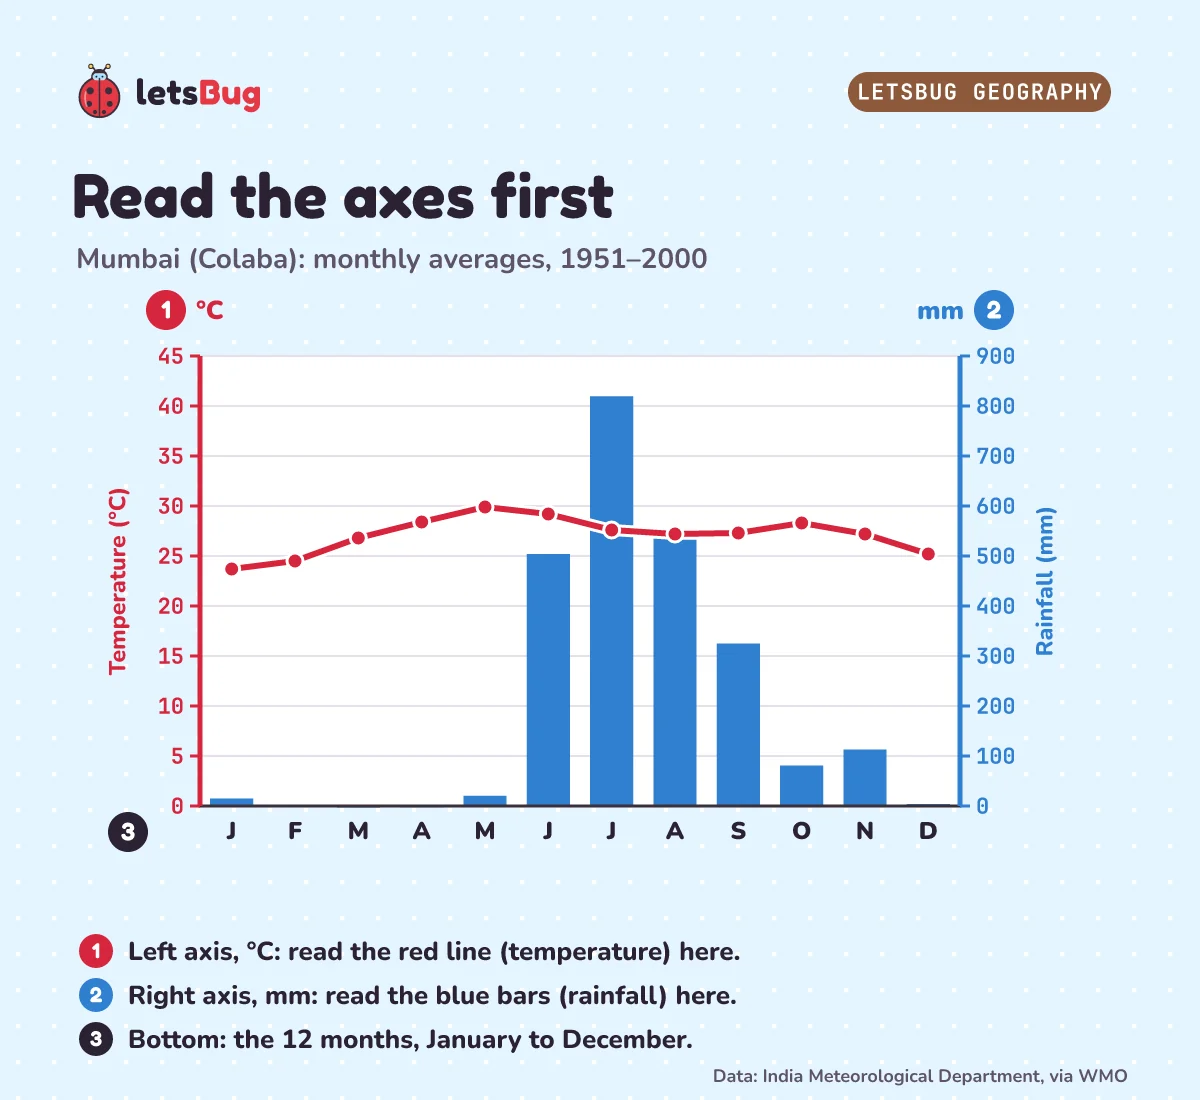
- Read the title. Which place, and which years? Here: Mumbai (Colaba), averages for 1951–2000.
- Bottom axis: the 12 months, January to December.
- Bars: rainfall in millimetres. On this graph they're read on the right-hand axis, from 0 to 900 mm.
- Line: temperature in degrees Celsius, read on the left-hand axis, from 0 to 45 °C.
- Check before you read. The axis labelled mm belongs to the bars, the one labelled °C to the line. Reading a bar against the temperature scale is the most common slip.
Exam boards test exactly this. The Cambridge IGCSE Geography syllabus lists "climate graphs" among the graph types you must use, and asks you to "extract, interpret, analyse and evaluate information presented on graphs, charts and diagrams". AQA's GCSE asks you to "interpret and extract information from different types of maps, graphs and charts". And the CBSE Class 9 curriculum asks you to "Represent climatic data (temperature, rainfall, etc.) through appropriate graphs, charts, or diagrams."
Here are the numbers behind the graph:
| Month | Average daily max (°C) | Average daily min (°C) | Mean (°C) | Rainfall (mm) |
|---|---|---|---|---|
| Jan | 30.7 | 16.7 | 23.7 | 15.1 |
| Feb | 31.2 | 17.7 | 24.5 | 1.0 |
| Mar | 32.7 | 20.8 | 26.8 | 0.1 |
| Apr | 33.0 | 23.8 | 28.4 | 0.5 |
| May | 33.3 | 26.4 | 29.9 | 20.6 |
| Jun | 32.1 | 26.2 | 29.2 | 504.2 |
| Jul | 30.0 | 25.1 | 27.6 | 819.4 |
| Aug | 29.6 | 24.8 | 27.2 | 546.8 |
| Sep | 30.3 | 24.3 | 27.3 | 325.2 |
| Oct | 33.1 | 23.4 | 28.3 | 81.1 |
| Nov | 33.5 | 20.8 | 27.2 | 113.2 |
| Dec | 32.1 | 18.3 | 25.2 | 4.1 |
IMD publishes the average daily maximum and minimum for each month. The line on the graph is the monthly mean, worked out as (max + min) ÷ 2. For January: (30.7 + 16.7) ÷ 2 = 23.7 °C.
Reading the temperature line (and the July trap)
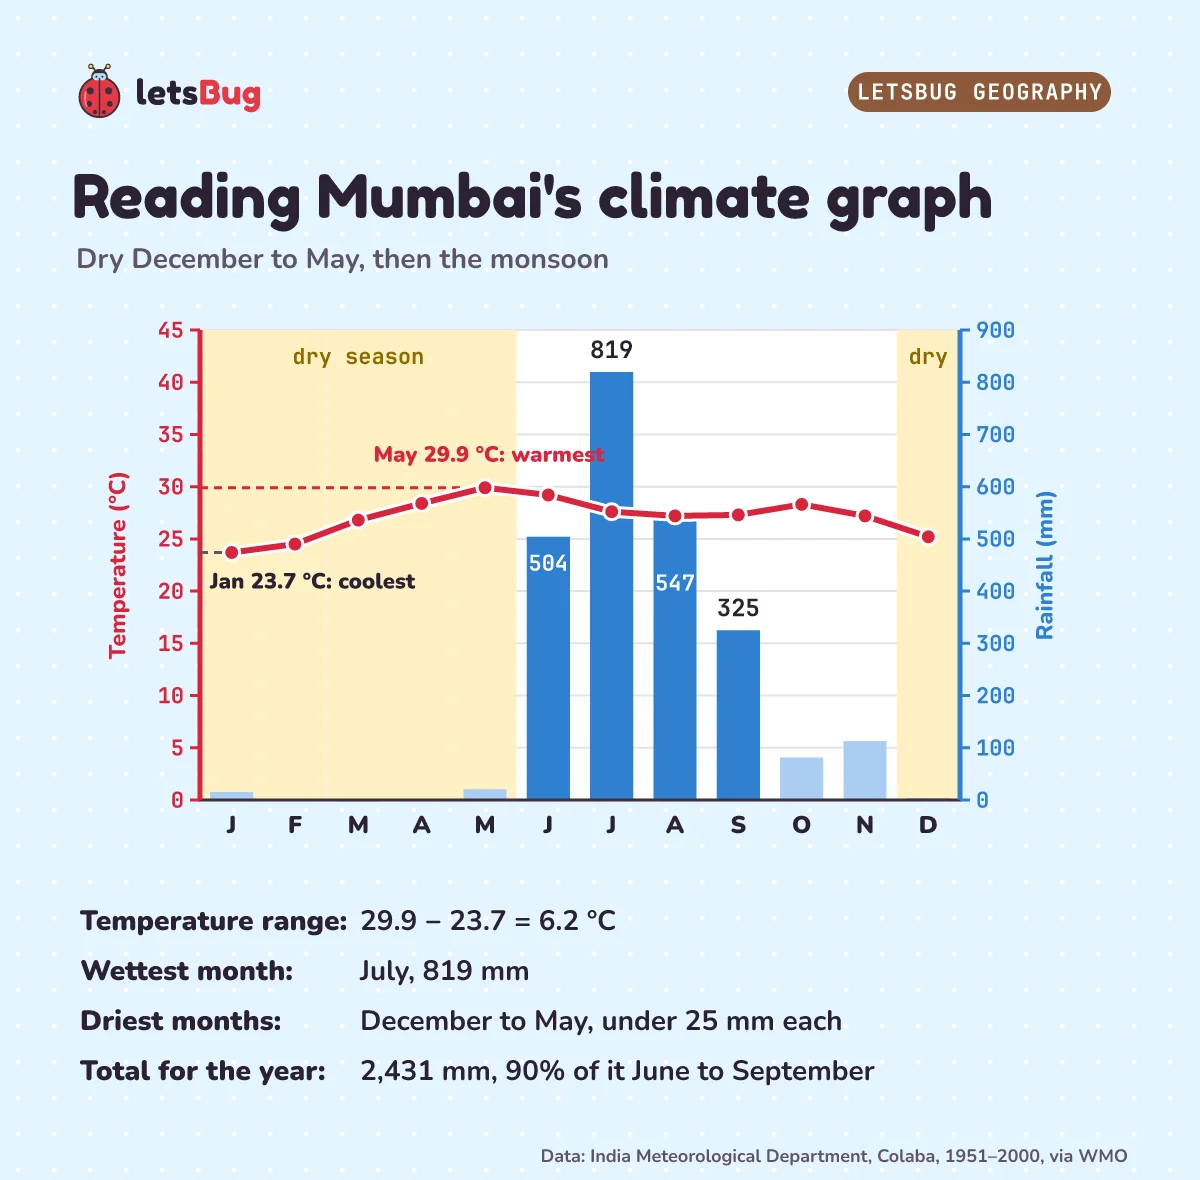
Mumbai is warm all year. The coolest month is January, at 23.7 °C (about 24 °C). The warmest is May, at 29.9 °C (about 30 °C). So the annual temperature range is 29.9 − 23.7 = 6.2 °C, about 6 °C. That's a small range: there's no cold season at all.
Now the trap. Many people guess that the hottest month is July, in the middle of the northern summer. But look at the line: it dips in June, July and August (29.2, 27.6 and 27.2 °C). That's the monsoon. "May is the hottest month of the year for Mumbai", and "July and August are characterized by almost non-stop rain and weeks of no sunshine." Thick cloud blocks the sun and the rain cools the ground, so the average daily maximum falls from 33.3 °C in May to 29.6 °C in August. Mumbai's hottest month comes just before the rains.
If you check the table, you'll see that October and November have daytime highs as warm as May's (33.1 and 33.5 °C). But their nights are much cooler (23.4 and 20.8 °C, against 26.4 °C in May), so May still has the highest mean temperature. That's why climate graphs plot the mean, not just the daytime high.
Reading the rainfall bars: the monsoon in numbers
From December to May, every month gets less than 25 mm of rain (the wettest of them, May, gets 20.6 mm). That's the dry season. Then, in June, the monsoon arrives with 504 mm. July is the peak, at 819 mm. August brings 547 mm and September 325 mm. October and November still get some rain, 81 mm and 113 mm.
That November figure is surprisingly high. Colaba's newer 1991–2020 averages give November only 8.5 mm and January 0.6 mm. An average over 50 years can be pulled up by a few unusually wet months, which is one more reason to say which years a climate graph covers.
Add up all twelve bars and you get 2,431 mm a year, about 2,430 mm. How much of that falls in the four monsoon months? That's your turn, below.
Mumbai vs London on the same scales
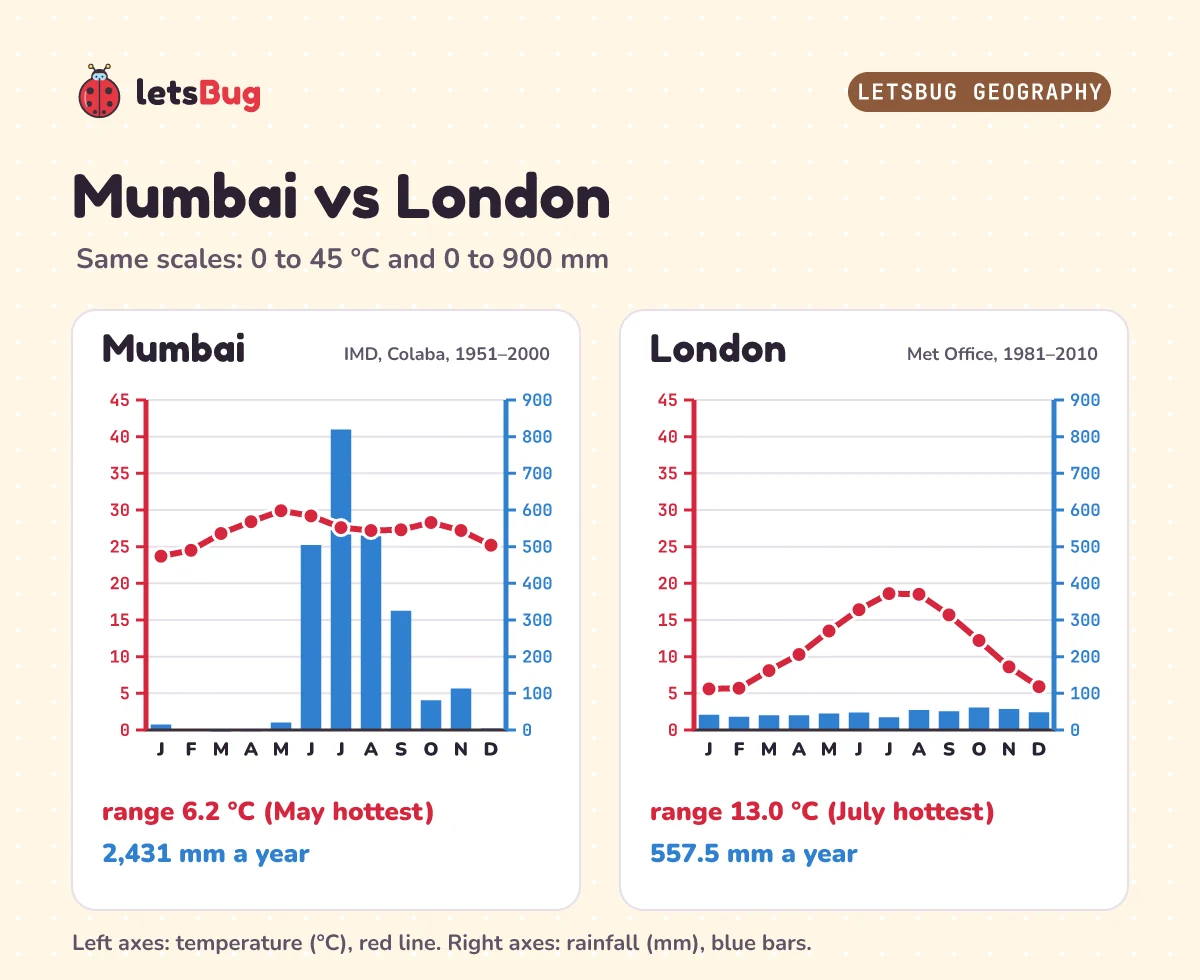
London's climate graph (Met Office averages, 1981–2010) looks completely different. It rains in every month, between 34.6 mm in July and 61.1 mm in October, for a total of 557.5 mm a year. Mumbai's July alone, at 819 mm, is wetter than London's entire year.
The temperature line is different too. London's coolest month is January, at 5.6 °C, and its warmest is July, at 18.6 °C: a range of 18.6 − 5.6 = 13.0 °C, more than double Mumbai's. And London's hottest month really is July, because London has no monsoon to cool its summer. So "July is the hottest month" isn't wrong everywhere. It's wrong for Mumbai, and the graph tells you which.
One rule when comparing two climate graphs: check that the scales match. Draw London on a 0 to 70 mm scale instead of 0 to 900 mm, and its bars would look as tall as Mumbai's.
How to describe a climate graph (4 marks)
First, the command word. The Cambridge IGCSE Geography syllabus defines describe as "state the points of a topic / give characteristics and main features", and explain as "set out purposes or reasons / make the relationships between things clear / say why and/or how and support with relevant evidence". Describe is what the graph shows. Explain is why.
Question: Describe the climate of Mumbai shown in the climate graph. (4 marks)
Strong answer: Temperatures are high all year, from about 24 °C in January to about 30 °C in May, a small range of about 6 °C. Rainfall is very seasonal. From December to May there is less than 25 mm a month. From June to September it is very wet, peaking at 819 mm in July. The total is about 2,430 mm a year. Temperatures dip slightly in the wettest months.
Here's where the four marks come from:
- the temperature pattern (high all year, small range), with a figure and its unit;
- a second temperature figure with its month, or the range worked out;
- the rainfall pattern: a dry season and a wet season, with months;
- a rainfall figure with its unit and month, such as 819 mm in July, or the yearly total.
Leave out "because of the monsoon" in a describe answer: it's explanation, and it uses time without adding marks. Save it for the "explain" or "suggest" question that usually follows.
Your turn. Farmers and water planners need to know how much of the year's rain the monsoon brings. In Mumbai, June, July, August and September bring 504, 819, 547 and 325 mm. The whole year brings 2,431 mm. What percentage falls in those four months?
Show the answer
Add the four months: 504 + 819 + 547 + 325 = 2,195 mm. Then 2,195 ÷ 2,431 × 100 = 90.3%. About 90% of Mumbai's rain falls in just four months. If rain fell evenly through the year, four months would get only 4 ÷ 12 of it, about 33%.
Exam-style questions with model answers
Q1 (1 mark). Define the term climate.
Model answer
The average weather conditions of a place over a long period, usually 30 years [1].
Q2 (2 marks). State two differences between weather and climate.
Model answer
Weather is short-term, over hours or days; climate is long-term, usually 30 years [1]. Weather is the conditions at one time; climate is the average or expected pattern [1].
Q3 (2 marks). Using the climate graph for Mumbai, calculate the annual temperature range.
Model answer
Warmest month May 29.9 °C, coolest January 23.7 °C [1]. Range = 29.9 − 23.7 = 6.2 °C, about 6 °C [1]. Give the unit.
Q4 (2 marks). Suggest why Mumbai's hottest month is May rather than July.
Model answer
The monsoon arrives in June [1]. Thick cloud and heavy rain from June to August cut the sunshine and cool the air, so temperatures peak just before the rains [1].
Q5 (3 marks). Compare the rainfall of Mumbai and London.
Model answer
Mumbai's rainfall is very seasonal, with a dry season from December to May and a wet season from June to September; London's is spread across every month [1]. Mumbai's wettest month (July, 819 mm) gets far more than London's wettest (October, 61.1 mm) [1]. Mumbai's yearly total, about 2,430 mm, is more than four times London's 557.5 mm [1]. A comparison needs both places in each sentence: "whereas" and "but" help.
Q6 (2 marks). London gets 47.4, 34.6, 54.3 and 51.0 mm from June to September, and 557.5 mm in a year. Calculate the percentage that falls from June to September.
Model answer
47.4 + 34.6 + 54.3 + 51.0 = 187.3 mm [1]. 187.3 ÷ 557.5 × 100 = 33.6% [1]. That's close to a third, what you'd expect if rain were spread evenly, compared with about 90% for Mumbai.
Q7 (2 marks). Is each statement about weather or climate? (a) "Mumbai had 944 mm of rain on 26 July 2005." (b) "London's average October rainfall is 61.1 mm."
Model answer
(a) Weather: one day's conditions [1]. (b) Climate: a long-term average [1].
Questions people ask
What is the difference between weather and climate?
Weather is the state of the atmosphere at one place over hours or days. Climate is the average weather of a place over a long period, usually 30 years. Climate is what you expect; weather is what you get.
How do you read a climate graph?
Read the axes first: months along the bottom, rainfall bars on one vertical axis in mm, the temperature line on the other in °C. Then find the warmest and coolest months, work out the range, find the wettest and driest months and add up the year's rainfall.
Why does a climate graph use bars and a line?
Rainfall is an amount that falls during each month, so it's drawn as bars. Temperature is an average level that changes smoothly through the year, so it's drawn as a line. Each has its own scale, so check which axis is which.
How do you work out the temperature range from a climate graph?
Subtract the coolest month's temperature from the warmest month's. For Mumbai: 29.9 − 23.7 = 6.2 °C. Always give the unit.
Why is May the hottest month in Mumbai?
The monsoon arrives in June. From June to August, thick cloud and heavy rain block the sun and cool the air, so temperatures peak in May, just before the rains.
Why is climate measured over 30 years?
A long average smooths out unusual days and years. Weather services use the same 30-year periods, called climate normals, such as 1991–2020, so places can be compared fairly.
Keep going
- Watch the full lesson, How to Read a Climate Graph: Weather vs Climate, or the one-minute version: Mumbai gets more rain in July than London gets all year.
- Earlier in the series: why do earthquakes and volcanoes happen? (plate tectonics) and how are earthquakes measured?
- Next in the series is global atmospheric circulation: the giant loops of air that explain why the Sahara sits where it does.
Sources
- WMO World Weather Information Service: Mumbai climatological information (India Meteorological Department, Colaba, 1951–2000) and London climatological information (Met Office, 1981–2010)
- Met Office: What is climate?
- NOAA National Centers for Environmental Information: WMO Climate Normals
- CBSE: Class IX Social Science curriculum 2026-27 (Unit 3, Atmosphere and Climate)
- Cambridge IGCSE Geography 0460: syllabus for 2027 to 2029 (graphical skills, climate graphs, command words)
- AQA GCSE Geography 8035 specification: Geographical skills
- Wikipedia: 2005 Maharashtra floods, Climate of Mumbai (May the hottest month, Santacruz's 1991–2020 July rainfall, 1991–2020 Colaba normals), Kharif crop
Every number in this post was checked against these sources, and every calculation (the monthly means, ranges, totals and percentages) was checked in Python before publishing.