We know the climate is changing because three kinds of evidence agree. Thermometers show 2011–2020 was about 1.1 °C warmer than 1850–1900. Bubbles of old air in ice show today's carbon dioxide is the highest in 800,000 years. Seas are rising faster. The cause: extra heat-trapping gases from burning coal, oil and gas, farming and cutting down forests.
In this post we start with one famous measurement, taken on a volcano in Hawaii since 1958. Then we look at each kind of evidence with real numbers. Next we correct a common mistake: the ozone hole (a thin patch in a layer of gas high above us) is not what is warming the planet. After that: how the greenhouse effect works, the natural and human causes of climate change, and how to write a strong exam answer. Every hard word is explained the first time it comes up.
Key takeaways
- Climate is the average weather of a place, usually over 30 years. Climate change is a long-term change in those averages.
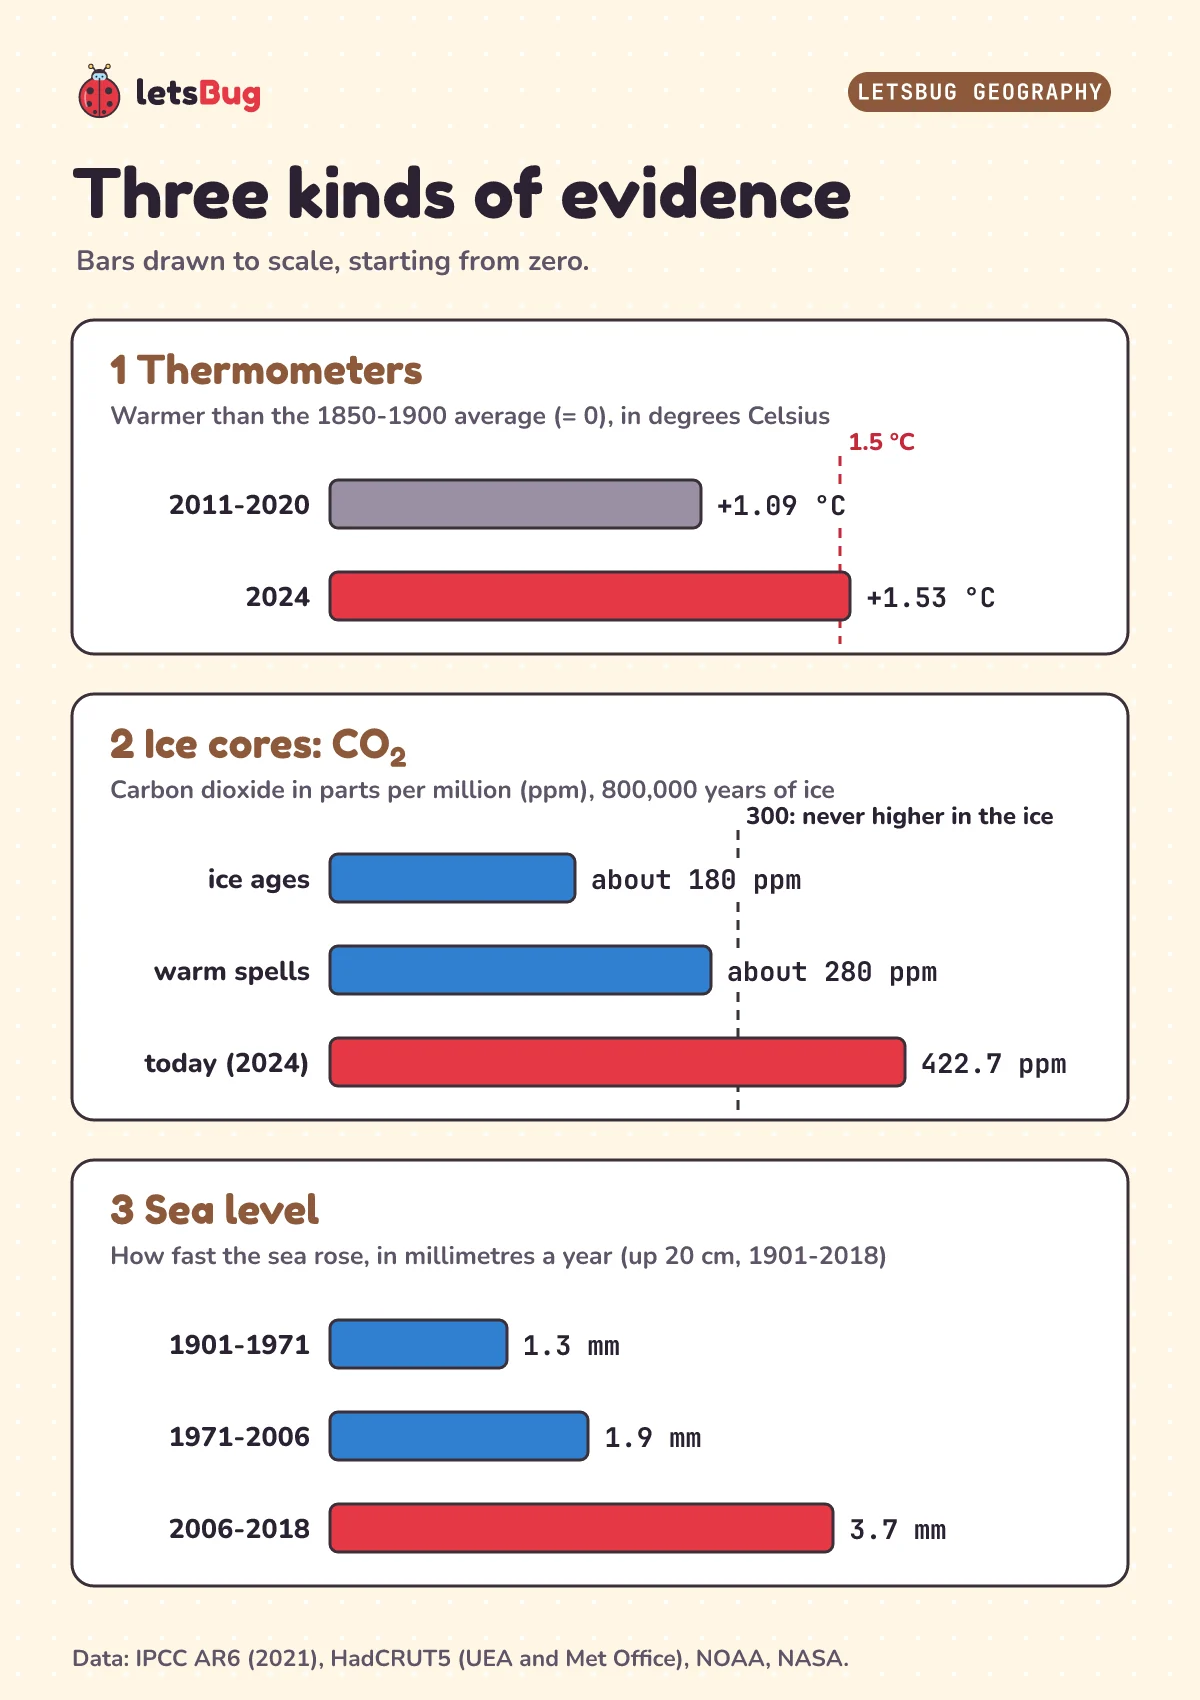
- Thermometers: 2011 to 2020 was 1.09 °C warmer than the 1850 to 1900 average. 2024 was about 1.53 °C warmer, the warmest year on record.
- Ice cores (long tubes of old ice, with air trapped inside): over 800,000 years, carbon dioxide went up and down between about 180 and 280 parts per million (ppm: out of every million molecules, or tiny particles, of air, how many are carbon dioxide), and never above 300. In 2024 the world average was 422.7.
- Sea level rose about 20 cm from 1901 to 2018, and it is rising faster: 1.3 mm a year at first, 3.7 mm a year from 2006 to 2018.
- The ozone hole is not the cause. It lets more ultraviolet light (light we can't see, which causes sunburn) reach the ground, which is a health problem. Its overall effect on temperature is a small cooling.
- The greenhouse effect: greenhouse gases absorb the heat the ground gives off and send some back down. More of these gases trap more heat.
- Natural causes (Earth's orbit, volcanoes, the Sun) can't explain the recent warming. Human causes can: burning fossil fuels (coal, oil and gas), farming and deforestation (cutting down forests).
This post goes with letsBug Geography, episode 6. It covers climate change. That topic is part of the "Living with the physical environment" paper in GCSE Geography from AQA, an exam board in England. It is also in the Atmosphere and Climate theme of the CBSE Class 9 Social Science curriculum. Watch the lesson, or read on. The post adds the exact figures from the IPCC (the UN's climate science panel) and NASA. It also has a chart of all three kinds of evidence and a drawing that compares the ozone hole and the greenhouse effect. And there are worked answers to every practice question.
What is the Keeling curve?
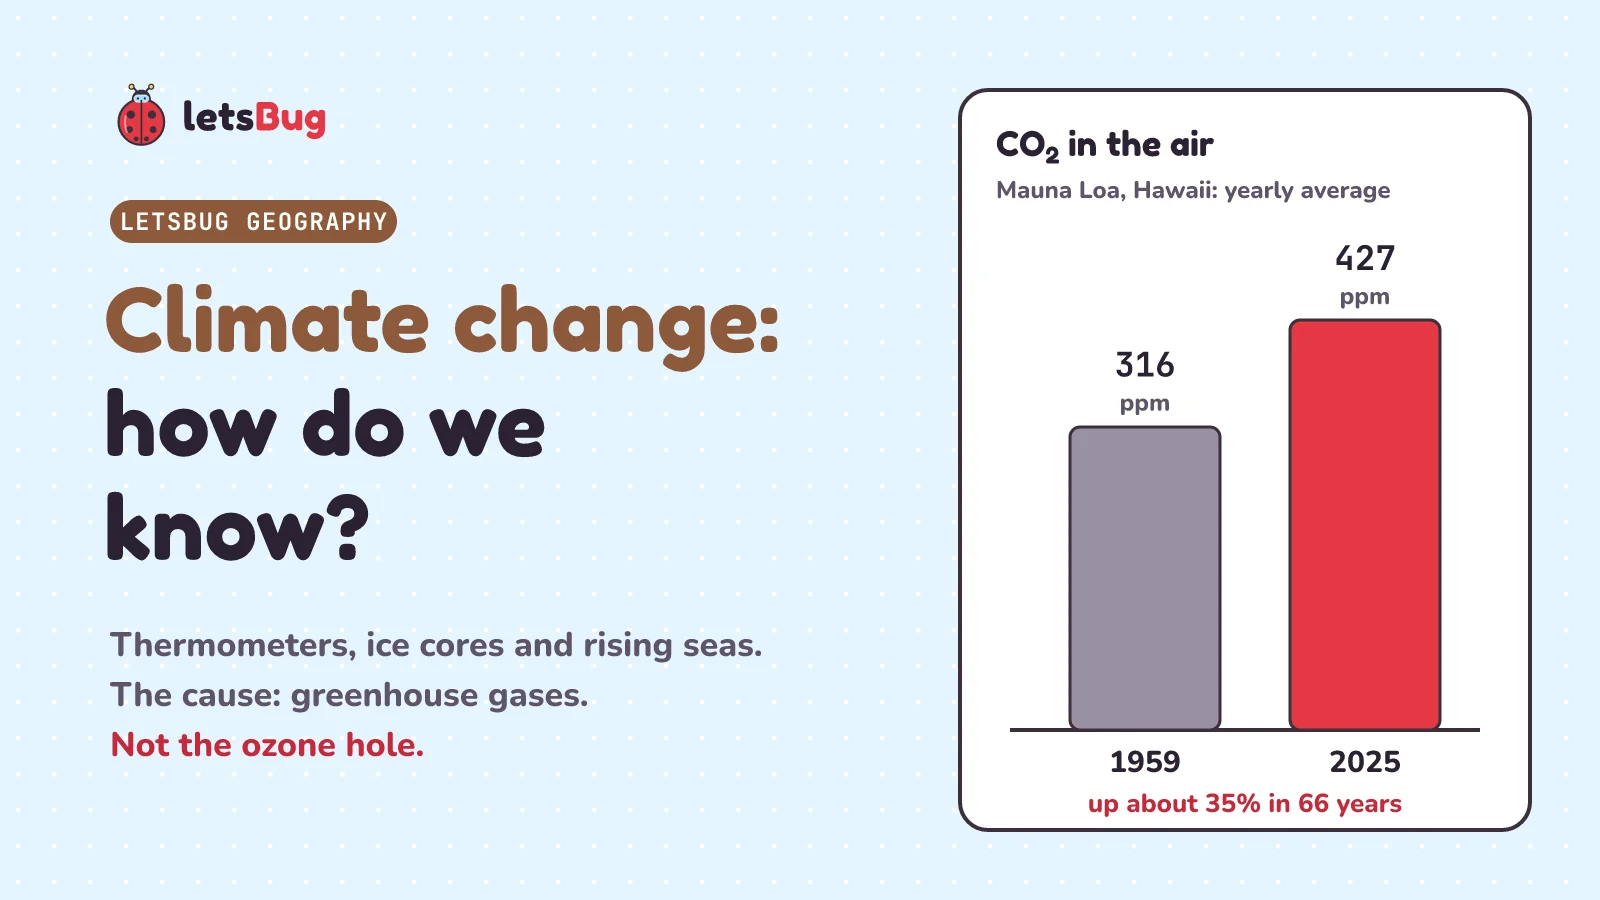
The Keeling curve is the graph of carbon dioxide measured on Mauna Loa, a volcano in Hawaii, since 1958. NOAA, the US weather and oceans agency, tells the story: "Charles David Keeling, a scientist with the Scripps Institution of Oceanography, initiated on-site measurements of CO2 at NOAA's weather station on Mauna Loa in 1958." (Initiated means started. CO2 is carbon dioxide.) His record "came to be known as the Keeling Curve". NOAA started its own measurements there in 1974, side by side with Keeling's institute, a US ocean science centre.
NOAA calls it "the longest record of direct measurements of CO2 in the atmosphere". (The atmosphere is the layer of air around the Earth.) The station is 3400 m above sea level. NOAA says it "samples air undisturbed by the influence of local pollution", so the air it measures is not spoiled by nearby cars or factories.
Carbon dioxide is measured in parts per million (ppm): out of every million molecules (tiny particles) of dry air, how many are carbon dioxide. NOAA's example: "0.000400 is expressed as 400 ppm."
These two numbers come from NOAA's data file of yearly averages:
- 1959: 315.98 ppm, about 316.
- 2025: 427.35 ppm, about 427.
That's a rise of 427 − 316 = 111 ppm in 66 years. The record still goes on: NOAA's latest monthly average is 426.07 ppm, for September 2026. That is a little below the 2025 yearly average, and that's normal. NOAA says carbon dioxide in the north "fell during the growing season, and rose as plants died back in the fall". So it dips each northern summer while plants grow, then rises again. (Fall is the American word for autumn.)
What is climate change?
First, what climate means. The Met Office, the UK's national weather service: "Climate is the general weather over a long period." And: "We usually define a region's climate over a period of 30 years." So one cold week is weather, not climate. To see a real place's climate, month by month, read how to read a climate graph.
Climate change is a long-term change in those averages, like a rise in the world's average temperature.
The evidence we use goes back a long way. AQA's GCSE asks for "Evidence for climate change from the beginning of the Quaternary period to the present day." The Quaternary is the most recent period of the Earth's history. The Quaternary Research Association, a UK society of scientists who study it, says it "covers the last 2.6 million years up to the present day". It adds that this time is "widely known as 'The Ice-Age'".
We'll look at three kinds of evidence: thermometer records, ice cores, and the oceans and ice.
What do thermometer records show?
Reliable records of the whole world's temperature start in 1850. Scientists compare each year with the average for 1850 to 1900, before most of the warming. This average is the baseline: the starting level everything is measured against.
The IPCC (Intergovernmental Panel on Climate Change) is the United Nations' climate science panel. Its 2021 report says: "Global surface temperature was 1.09 [0.95 to 1.20] °C higher in 2011–2020 than 1850–1900". The numbers in square brackets are the range scientists are very sure the true value lies in. It also says: "Each of the last four decades has been successively warmer than any decade that preceded it since 1850." (Successively means each one in turn. Preceded means came before.)
Then came 2024. UK scientists at the Met Office, the University of East Anglia and the National Centre for Atmospheric Science work out the world's temperature together. Their record is called HadCRUT5. The university's Climatic Research Unit says: "2024 was the warmest year on record globally and the first year that was likely more than 1.5°C above its pre-industrial levels". Pre-industrial means before the Industrial Revolution, when factories and coal power spread, from the mid-1700s. Records of the whole world's temperature only start in 1850, so scientists use 1850 to 1900 to stand for it. The Climatic Research Unit calls this the baseline "commonly used as the pre-industrial level". The number for 2024 was 1.53 °C.
Does that mean the world has broken the Paris Agreement's 1.5 °C goal? The Paris Agreement is a deal between the world's countries. It aims to keep warming well below 2 °C, and to try to keep it closer to 1.5 °C. The answer is: not yet. The same team: "No, the Paris 1.5°C goal has not yet been exceeded". (Exceeded means gone past.) The goal is usually taken to mean the warming averaged over more than ten years, not one year.
How do ice cores show past climate?
Near the poles and high in the mountains, snow piles up year after year and gets squashed into ice, layer on layer. The ice traps tiny bubbles of air. Scientists drill out long tubes of this ice, called ice cores. Each year's snow lies on top of the last, so the deeper the ice, the older the air in its bubbles. An ice core keeps a record of old air. NOAA's science data centre (NCEI) says the layers "contain dust, air bubbles, or isotopes of oxygen, differing from year to year". These tell scientists about past climates. (Isotopes are atoms of the same element with slightly different weights.) Climate.gov, NOAA's climate website, shows carbon dioxide "for the past 800,000 years based on ice-core data".
What does the old air show? Carbon dioxide went up and down with the ice ages. NASA: "During past glacial cycles, the concentration of carbon dioxide in our atmosphere fluctuated from about 180 parts per million (ppm) to 280 ppm". (Glacial cycles are the repeating ice ages and the warm spells between them. Concentration means how much of it there is in the air. Fluctuated means went up and down.) So it was about 180 ppm in the cold ice ages, and about 280 ppm in the warm spells. Climate.gov: during the ice age cycles of the past million years or so, "atmospheric carbon dioxide didn't get any higher than 300 ppm."
Now compare today's air. Climate.gov: "The global average carbon dioxide set a new record high in 2024: 422.7 parts per million". That is far above anything in the ice. The IPCC goes further: "In 2019, atmospheric CO2 concentrations were higher than at any time in at least 2 million years". And it is rising fast. Climate.gov: "The increase over the last 60 years is 100 times faster than previous natural increases." For example, it is 100 times faster than the rise at the end of the last ice age, 11,000 to 17,000 years ago.
Notice the three different numbers: 427.35 ppm (Mauna Loa's yearly average in 2025), 426.07 ppm (Mauna Loa, one month), and 422.7 ppm (the average over the whole world in 2024). They come from different places and years, so they don't match exactly.
What do sea level and ice show?
The IPCC: "Global mean sea level increased by 0.20 [0.15 to 0.25] m between 1901 and 2018." That's about 20 cm. (Mean means average, here over the whole world.) And it is speeding up. The IPCC gives the average rate for three periods:
- 1901 to 1971: 1.3 mm a year
- 1971 to 2006: 1.9 mm a year
- 2006 to 2018: 3.7 mm a year, nearly three times as fast as at first (3.7 ÷ 1.3 = 2.8)
Two things push the sea up. Climate.gov: "The rising water level is mostly due to a combination of melt water from glaciers and ice sheets and thermal expansion of seawater as it warms." A glacier is a large mass of ice that moves slowly over land. An ice sheet is a huge glacier that covers a very large area of land, like the ones on Greenland and Antarctica. Thermal expansion means water takes up more space as it warms.
The ice is shrinking too. NASA: "Glaciers are retreating almost everywhere around the world — including in the Alps, Himalayas, Andes, Rockies, Alaska, and Africa." (Retreating means shrinking back.) In the Arctic, the frozen sea is shrinking as well. This sea ice is sea water that freezes on the surface. NSIDC, the US snow and ice data centre: "Sea ice is frozen ocean water. It forms, grows, and melts entirely in the ocean." So it is not one of the two things Climate.gov names as pushing the sea up. But its loss is a sign of warming. The IPCC says the Arctic's sea ice area fell between 1979–1988 and 2010–2019, with "decreases of about 40% in September and about 10% in March".
Does the ozone hole cause global warming?
No. Many people think the two are the same thing. The ozone hole is a real problem, but a different one.
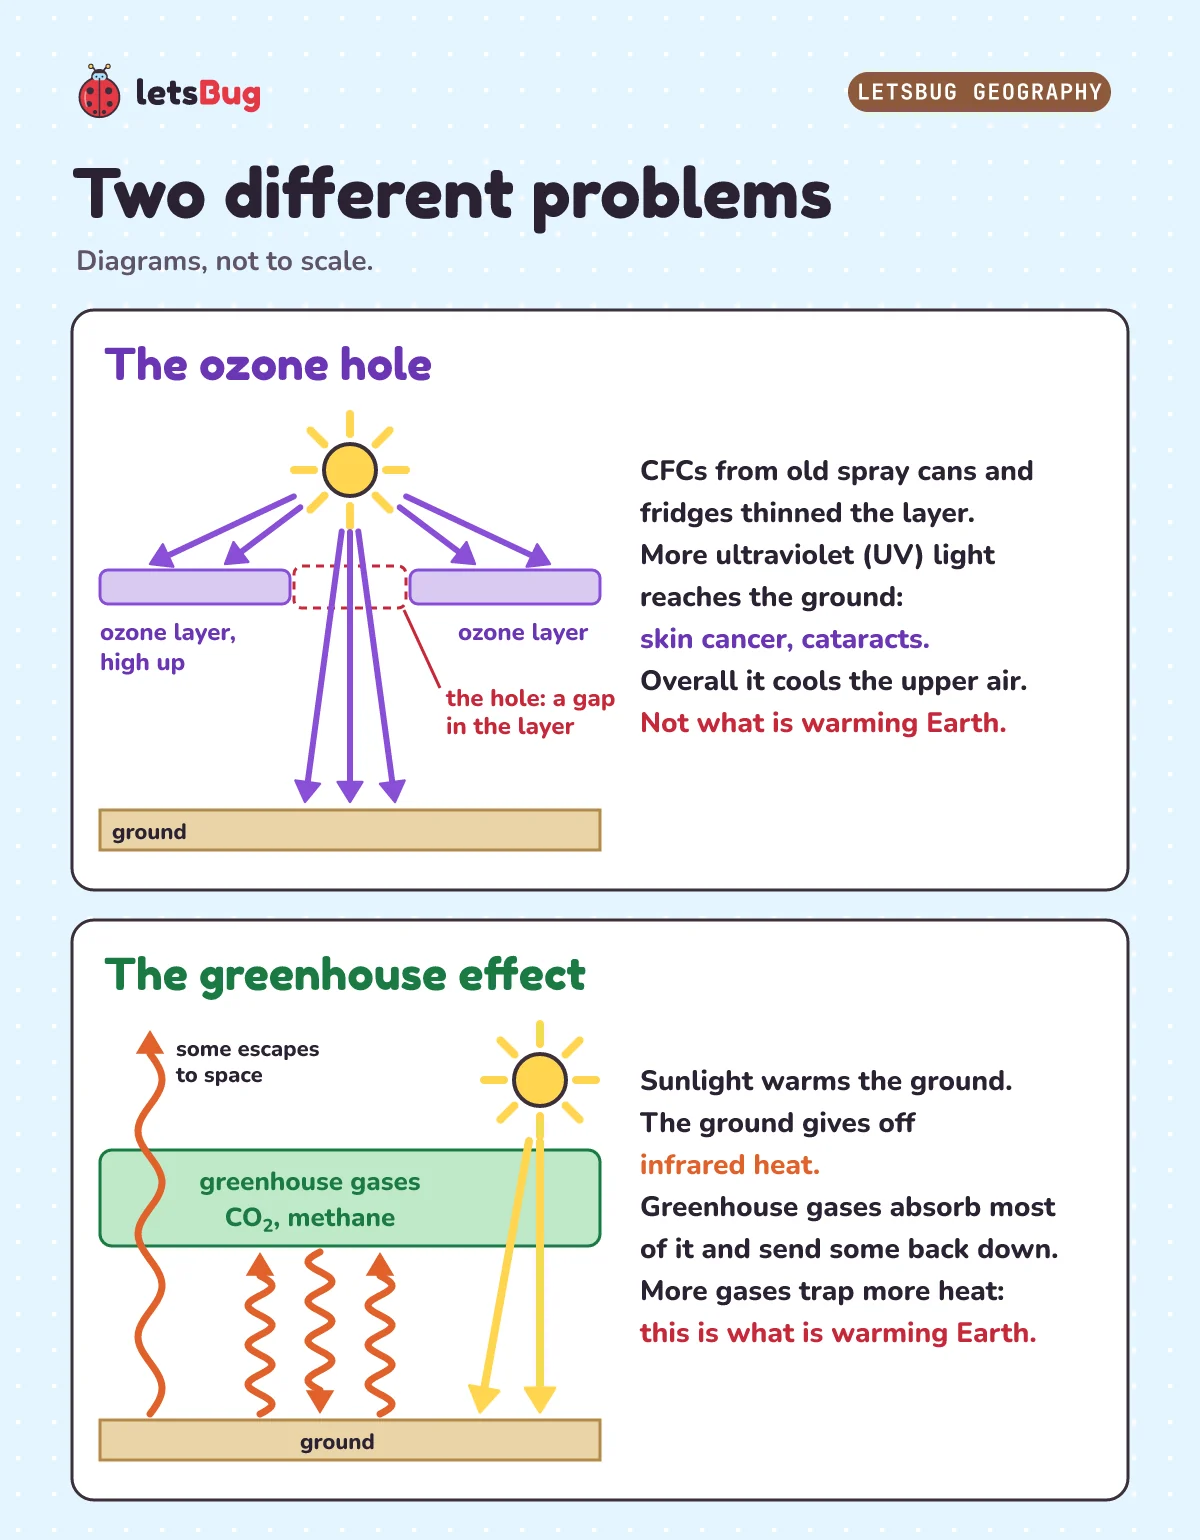
Ozone is a gas whose molecules are made of three oxygen atoms. About 90% of it sits in a layer high up in the stratosphere. NASA: "The stratosphere is the layer of atmosphere extending from about 10 km to 50 km (6-30 miles) in altitude." (Altitude means height above sea level.) NASA: "The ozone layer, which lies high in the atmosphere, shields us from harmful ultraviolet (UV) rays that come from the Sun." Ultraviolet (UV) light is a kind of light we can't see. It is what causes sunburn.
Chemicals called CFCs (chlorofluorocarbons) were once used in spray cans and fridges. They thinned the ozone layer. Now a hole opens over Antarctica each year in the southern spring (spring in the southern half of the Earth). NASA says CFCs "break down ozone molecules in the upper atmosphere". More UV light then reaches the ground. NOAA and the WMO (the World Meteorological Organization, the UN's weather agency) explain why that matters. "In humans, increased exposure to UV-B radiation raises the risks of skin cancer and cataracts, and suppresses the immune system." UV-B is one kind of UV light. Exposure means how much of it reaches you. Suppresses the immune system means weakens the body's defence against illness. Cataracts make the lens of the eye cloudy.
But extra UV light doesn't warm the planet. NASA: "While some extra UV rays slip through the ozone hole, their net effect is to cool the stratosphere more than they warm the troposphere." (Net effect means overall result.) The troposphere is the lowest layer of air, where we live and where weather happens. NASA again: "So, this increase in UV rays cannot explain the warming of the planet's surface."
The NOAA and WMO report on the ozone layer asks this exact question: "Is depletion of the ozone layer the principal cause of global climate change?" (Depletion means using up. Principal means main.) Its answer: "No, ozone depletion is not the principal cause of global climate change." And: "The best estimate is that stratospheric ozone depletion has led to a small amount of surface cooling."
There is one real link. CFCs are also greenhouse gases (gases that trap heat; more on these below). The Montreal Protocol is an agreement between countries, signed in 1987, that controls how much CFCs and similar chemicals countries can make and use. NOAA and the WMO: "The Montreal Protocol has also decreased the human drivers of global warming, because many CFCs and HFCs are potent greenhouse gases (GHGs)." Drivers means causes. Potent means strong. HFCs are gases that replaced CFCs: NOAA and the WMO call them "transitional substitute compounds for CFCs". GHGs is short for greenhouse gases. So protecting the ozone layer also cut some of the human causes of global warming. NASA's own answer to the question starts "Yes and no." But NASA also says the role of the hole itself "is small compared to the impacts coming from human activities." Here, those impacts are the greenhouse gases people add.
How does the greenhouse effect work?
So what is warming the planet? The greenhouse effect. NASA explains it in two steps:
- Sunlight in. "About half the light energy reaching Earth's atmosphere passes through the air and clouds to the surface, where it is absorbed and radiated in the form of infrared heat." (Radiated means given off.) Infrared is light we can't see that carries heat, like the warmth you feel near a heater.
- Heat trapped. "About 90% of this heat is then absorbed by greenhouse gases and re-radiated, slowing heat loss to space." Greenhouse gases, like carbon dioxide and methane, take in this heat and send some of it back down. So the heat escapes to space more slowly.
The greenhouse effect is not bad on its own. NOAA and the WMO: "Without this natural greenhouse effect, Earth's surface would be much colder than current conditions." NASA says the natural greenhouse effect keeps Earth's average temperature at 15 °C (59 °F).
The problem is adding more of these gases. More greenhouse gases absorb more of the heat, so the Earth warms. This is called the enhanced greenhouse effect (enhanced means made stronger). It is what is warming the planet now.
Here are the two problems side by side.
| The ozone hole | The greenhouse effect | |
|---|---|---|
| What happens | The ozone layer high up gets thinner | Gases in the air trap heat |
| Which gases | CFCs break down ozone | Carbon dioxide, methane and others |
| What kind of light | More ultraviolet light from the Sun gets in | Infrared heat from the ground is held in |
| Effect on temperature | A small cooling | Warming |
| Effect on people | More skin cancer and cataracts | Rising seas, as warmer water expands and ice on land melts |
What are the natural causes of climate change?
Climate has always changed for natural reasons. AQA's specification (the official list of what the exam covers) names three: "orbital changes, volcanic activity and solar output". (Solar means from the Sun.)
- Earth's orbit. The path of the Earth around the Sun, and the tilt of its axis (the line it spins around), change slowly in regular cycles, called Milankovitch cycles. NASA says they help explain "the beginning and end of Ice Ages throughout Earth's history". NASA: "Milankovitch cycles operate on long time scales, ranging from tens of thousands to hundreds of thousands of years."
- Volcanoes. A big eruption can cool the planet for a year or two. In June 1991 Mount Pinatubo, in the Philippines, erupted. NASA: "Pinatubo injected about 15 million tons of sulfur dioxide into the stratosphere". (Sulfur dioxide is a gas that volcanoes give off.) It formed a thin layer of tiny particles high in the air. NASA says these particles "scatter and absorb incoming sunlight", so less sunlight reached the ground. NASA: "over the next 15 months, scientists measured a drop in the average global temperature of about 1 degree F (0.6 degrees C)." To see why volcanoes form where they do, read why earthquakes and volcanoes happen.
- The Sun. The Sun's output rises and falls a little, in a cycle about 11 years long.
Why can't natural causes explain today's warming?
Because none of them fits what has happened since the 1950s.
- The Sun hasn't got stronger. NASA: "The amount of solar energy that Earth receives has followed the Sun's natural 11-year cycle of small ups and downs with no net increase since the 1950s." (Net increase means overall increase.) Over the same time, the world has warmed a lot.
- Earth's orbit should be cooling us. NASA: "If there were no human influences on climate, scientists say Earth's current orbital positions within the Milankovitch cycles predict our planet should be cooling, not warming".
- Volcanoes cool, and only for a short time. NASA says Pinatubo cooled the Earth's surface "for a period of almost two years".
The IPCC worked out how big the natural effect was. From 1850–1900 to 2010–2019, natural causes likely changed the world's temperature by only between −0.1 °C and +0.1 °C.
How much of the warming is caused by humans?
All of it, by the IPCC's best estimate. Its best estimate of the warming caused by humans, from 1850–1900 to 2010–2019, is 1.07 °C. The warming actually measured over the same time was 1.06 °C. The two numbers are almost exactly the same. The IPCC's first headline: "It is unequivocal that human influence has warmed the atmosphere, ocean and land." (Unequivocal means there is no doubt.)
AQA lists three human causes: "use of fossil fuels, agriculture and deforestation". (Agriculture means farming.) These are the facts behind each one.
- Fossil fuels are coal, oil and gas. NASA lists "burning fossil fuels and deforestation" among the human activities that release carbon dioxide.
- Farming. NASA uses the word emit, which means give off: "Livestock animals emit methane from their digestion and manure." And methane "is also released from landfills and rice farming". Livestock means farm animals like cattle. Manure is animal dung. Landfills are rubbish dumps. Methane is a greenhouse gas.
- Deforestation means cutting down forests. NASA: "plants absorb carbon dioxide and sunlight to create fuel—glucose and other sugars". (Here, fuel means the plant's food.) So fewer trees take in less carbon dioxide. NASA also says that in the tropics (the hot band on either side of the equator), forests are often removed by fire, "and this releases carbon dioxide."
How can human activities cause climate change?
This is a classic exam question. There's a weak answer and a strong one.
A weak answer says: pollution makes a hole in the ozone layer, which lets more heat in. That's the mistake we looked at earlier, and it misses the real cause. A strong answer links each activity to a gas, and the gas to the heat:
- Burning fossil fuels (coal, oil and gas) in power stations, vehicles and factories releases carbon dioxide.
- Farming releases methane: from cattle (their digestion and manure) and from rice fields.
- Deforestation leaves fewer trees to take in carbon dioxide, and burning trees releases more.
- More greenhouse gases absorb more of the infrared heat given off by the Earth, so less escapes to space: the enhanced greenhouse effect warms the planet.
Your turn. These are the practice questions from the video. Try each one before you open the answers.
1) How can human activities cause climate change?
2) Is the ozone hole the cause of global warming?
3) Carbon dioxide at Mauna Loa rose from 316 ppm in 1959 to 427 ppm in 2025. What is the percentage increase?
Show the answers
1) Link activity, gas and heat. Burning fossil fuels releases carbon dioxide. Cattle and rice farming release methane. Cutting down forests leaves fewer trees to take in carbon dioxide. More greenhouse gases trap more of the Earth's infrared heat: the enhanced greenhouse effect.
2) No. The ozone hole lets more ultraviolet light reach the ground, which raises the risk of skin cancer. Its overall effect on temperature is a small cooling. The warming comes from greenhouse gases trapping infrared heat. (CFCs, which caused the hole, are also greenhouse gases.)
3) The increase is 427 − 316 = 111 ppm. Divide by the original number and multiply by 100: 111 ÷ 316 × 100 = 35.1, about 35%, in 66 years. With NOAA's exact averages, (427.35 − 315.98) ÷ 315.98 × 100 = 35.2%. Always divide by the original (the "before") number, not the new one.
Exam-style questions with model answers
The number in brackets is the marks. Each mark is one clear point.
Q1. Give two pieces of evidence for climate change. [2]
Model answer
Thermometer records show the world was about 1.1 °C warmer in 2011–2020 than in 1850–1900 [1]. Global sea level rose about 20 cm between 1901 and 2018, and it is rising faster [1]. (Also correct: ice cores show carbon dioxide is now higher than at any time in 800,000 years; glaciers and Arctic sea ice are shrinking.)
Q2. Explain how ice cores give evidence of past climates. [3]
Model answer
As snow is squashed into ice, it traps bubbles of air [1]. Deeper ice is older, so the bubbles hold air from further back in time, up to about 800,000 years [1]. Scientists measure the carbon dioxide in the bubbles: about 180 ppm in ice ages and 280 ppm in warm spells, compared with 422.7 ppm in 2024 [1].
Q3. Explain how deforestation adds to climate change. [2]
Model answer
Trees take in carbon dioxide as they grow, so fewer trees take less carbon dioxide out of the air [1]. Burning forests releases carbon dioxide, a greenhouse gas that traps heat [1].
Q4. Describe one natural cause of climate change. [2]
Model answer
Large volcanic eruptions put sulfur dioxide high into the atmosphere, where it forms tiny particles that block some sunlight [1]. This cools the planet for a year or two: after Pinatubo in 1991, the world cooled by about 0.6 °C over 15 months [1]. (Also correct: slow changes in Earth's orbit and tilt, over tens of thousands of years, help start and end ice ages.)
Q5. Explain why the ozone hole is not the main cause of global warming. [2]
Model answer
The ozone hole lets in more ultraviolet light, but its overall effect is to cool the upper atmosphere, not warm the surface [1]. Global warming is caused by greenhouse gases, such as carbon dioxide, trapping the infrared heat the Earth gives off [1].
Q6. Before the Industrial Revolution, carbon dioxide was about 280 ppm. In 2024 it was 422.7 ppm. Calculate the percentage increase. [2]
Model answer
Increase = 422.7 − 280 = 142.7 ppm [1]. 142.7 ÷ 280 × 100 = 51.0, so about a 51% increase [1]. (Climate.gov says carbon dioxide is now "50 percent higher than it was before the Industrial Revolution".)
Questions people ask
What is the evidence for climate change?
Three kinds agree. Thermometers show 2011–2020 was about 1.1 °C warmer than 1850–1900. Ice cores show carbon dioxide is now higher than at any time in 800,000 years. And the sea rose about 20 cm from 1901 to 2018, faster and faster, as glaciers and ice sheets melt and warming sea water expands. Arctic sea ice is shrinking too.
Does the ozone hole cause global warming?
No. It lets more ultraviolet light reach the ground, which raises the risk of skin cancer and cataracts. Its overall effect on the world's temperature is a small cooling. Global warming is caused by greenhouse gases trapping heat.
What is the main cause of climate change?
Extra greenhouse gases from human activities: carbon dioxide from burning coal, oil and gas and from cutting down forests, and methane from farming.
How do we know it's not the Sun?
NASA says the energy Earth gets from the Sun has gone up and down in an 11-year cycle, with no overall increase since the 1950s. In the same time, the world has warmed a lot.
What is the Keeling curve?
The graph of carbon dioxide measured on Mauna Loa, Hawaii, since 1958. Charles David Keeling started it. The yearly average has gone from about 316 ppm in 1959 to about 427 ppm in 2025.
Is the greenhouse effect bad?
Not on its own. The natural greenhouse effect keeps the Earth's average temperature at about 15 °C. Without it, the Earth would be much colder. The problem is the enhanced greenhouse effect: extra gases from human activities trapping more heat.
Keep going
- Watch the full lesson, Climate Change Evidence and Causes: How Do We Know?, or the one-minute Short: Is the Ozone Hole Causing Global Warming? No. So What Is?. More in letsBug Geography on YouTube.
- The episode before this one: why do cyclones spin? (episode 5: how tropical storms form, with Cyclone Phailin).
- Weather or climate? See a real place's climate, month by month: how to read a climate graph (episode 3). Next in the series: waves, tides and coasts.
Checked on 14 November 2026 against the 22 sources below. Every number was taken from them. Every sum and percentage was worked out again in a Python script, and every quote was matched word for word with the source text.
Sources
- NOAA Global Monitoring Laboratory: Trends in atmospheric carbon dioxide (Mauna Loa) and Mauna Loa yearly averages (data file)
- NOAA: Carbon dioxide now more than 50% higher than pre-industrial levels (Charles David Keeling and the Keeling Curve)
- IPCC: Climate Change 2021, The Physical Science Basis: Summary for Policymakers (A.1, A.1.2, A.1.3, A.1.5, A.1.7, A.2.1)
- University of East Anglia, Climatic Research Unit: Global temperature 2024 (HadCRUT5)
- NOAA Climate.gov: Climate change: atmospheric carbon dioxide and Climate change: global sea level
- NASA Science: Evidence, Causes, Is the ozone hole causing climate change?, What is the greenhouse effect? and What is the Sun's role in climate change?
- NASA Science: Why Milankovitch (orbital) cycles can't explain Earth's current warming
- NASA Earth Observatory: Global effects of Mount Pinatubo
- NOAA Chemical Sciences Laboratory and WMO: Twenty Questions and Answers About the Ozone Layer: 2022 Update (Q1, Q6, Q17 and Q18)
- NOAA National Centers for Environmental Information: What are proxy data?
- NASA Earth Observatory: The carbon cycle
- National Snow and Ice Data Center: Quick facts about sea ice
- Met Office: What is climate?
- Quaternary Research Association: What is the Quaternary?
- AQA: GCSE Geography 8035 specification, Living with the physical environment (3.1.1.4 Climate change)
- CBSE: Class IX Social Science curriculum 2026-27